Remove 2019 Remove Data Warehouse Remove Prescriptive Analytics Remove Visualization
article thumbnail

Data Visualization and Visual Analytics: Seeing the World of Data

Sisense

In a world increasingly dominated by data, users of all kinds are gathering, managing, visualizing, and analyzing data in a wide variety of ways. One of the downsides of the role that data now plays in the modern business world is that users can be overloaded with jargon and tech-speak, which can be overwhelming.

article thumbnail

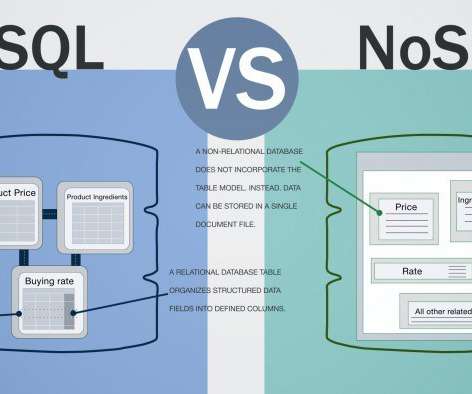
Top Database Reporting Tools You Can’t Miss (For Sql, Oracle and NoSQL)

FineReport

Database reporting tools are the reporting software that helps you directly generate reports of the data from the database or the data warehouse you use. There are two types of databases used in the company or organizations: relational databases and NoSQL data sources. . What is database reporting tools? From Google.

Insiders

Sign Up for our Newsletter

This site is protected by reCAPTCHA and the Google Privacy Policy and Terms of Service apply.

Trending Sources

article thumbnail

The Gartner 2021 Leadership Vision for Data & Analytics Leaders Webinar Q&A

Andrew White

As such any Data and Analytics strategy needs to incorporate data sovereignty as per of its D&A governance program. Coding skills – SQL, Python or application familiarity – ETL & visualization? See recorded webinars: Emerging Practices for a Data-driven Strategy. Link Data to Business Outcomes.

article thumbnail

What Is Embedded Analytics?

Jet Global

This is in contrast to traditional BI, which extracts insight from data outside of the app. We rely on increasingly mobile technology to comb through massive amounts of data and solve high-value problems. Bottom line is that analytics has migrated from a trendy feature to a got-to-have. Their dashboards were visually stunning.