article thumbnail

Reporting Solutions: A Complete Guide

FineReport

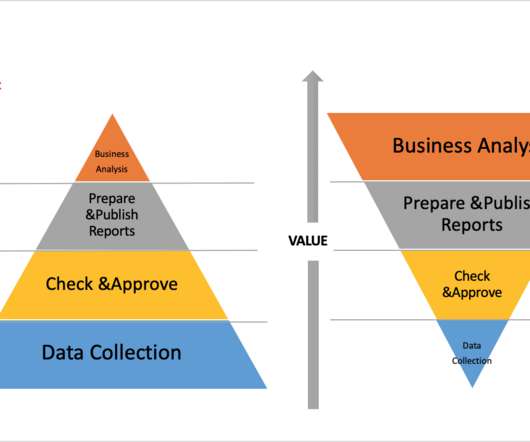
Besides, reporting solutions support managers put together a picture of the relevant data and discover business insides. For most companies, the staffs spend 50% time on data collection, 30% time on checking and approving the data, 15% time on developing and publishing the reports, and 5% on business analysis.

article thumbnail

Financial Dashboard: Definition, Examples, and How-tos

FineReport

Financial KPI Dashboard The financial KPI dashboard aggregates vital performance indicators that hold significant importance in business analysis and decision-making. Nevertheless, it is a crucial step that greatly impacts the accuracy of the report.

article thumbnail

Top 10 Key Features of BI Tools in 2020

FineReport

The metadata here is focused on the dimensions, indicators, hierarchies, measures and other data required for business analysis. It also includes some processed data, such as KPI, personal sales, single product sales and other data.