Remove Business Analysis Remove KPI Remove Management Remove Visualization
article thumbnail

How to Manage Business Operations Using Dashboards

InsightOut

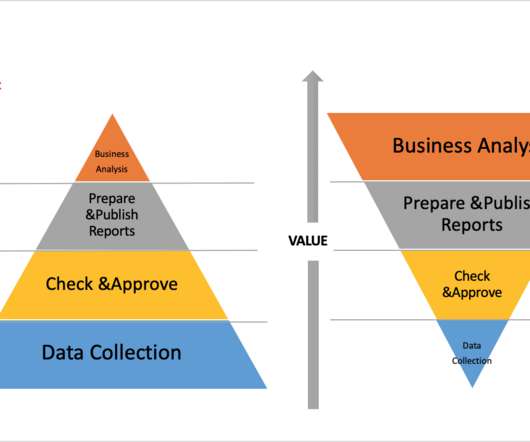
But in the future, you can overcome this challenge and benefit from having insights from data if you set up an effective management dashboard for your goals.xc2xa0 A dashboard is a visual information management tool that enables you to track relevant data points and key performance indicators (KPIs) at a glance.

article thumbnail

Your Data Won’t Speak Unless You Ask It The Right Data Analysis Questions

datapine

By asking the right questions, utilizing sales analytics software that will enable you to mine, manipulate and manage voluminous sets of data, generating insights will become much easier. Today, big data is about business disruption. It’s good to evaluate the well-being of your business first. Can you influence this development?

IT 317
Insiders

Sign Up for our Newsletter

This site is protected by reCAPTCHA and the Google Privacy Policy and Terms of Service apply.

Trending Sources

article thumbnail

Financial Dashboard: Definition, Examples, and How-tos

FineReport

A financial dashboard, one of the most important types of data dashboards , functions as a business intelligence tool that enables finance and accounting teams to visually represent, monitor, and present financial key performance indicators (KPIs).

article thumbnail

Reporting Solutions: A Complete Guide

FineReport

It frees you from the burden of reporting work and allows you to build valuable reports efficiently and manage these reports easily. Besides, reporting solutions support managers put together a picture of the relevant data and discover business insides. For top-level managers. From FineReport.

article thumbnail

Top 3 Tableau Alternatives for Data Analysis in the 21st Century

FineReport

It was an American interactive data visualization software company of business intelligence. With the Desktop CS architecture, Tableau runs more smoothly in the design of business analysis. It suits IT staff and business personnel. Data Management. Tableau : There are specialized modules to manage metadata.

KPI 52
article thumbnail

Seize The Power Of Analytical Reports – Business Examples & Templates

datapine

That’s why a business needs a proper analytical report that will help filter important data and improve the creation of the full management report that can lead to a successful business operation. The American Journal of Managed Care even stated in its own research that the total waiting amount is 121 minutes.

Reporting 245
article thumbnail

Business Intelligence Dashboard Software: Make Business Successful

FineReport

Business intelligence dashboard is a common module that general business intelligence has to realize data visualization. Be more specific, it is a data virtualization tool that shows the status of measurement information and key business indicators (KPI) to enterprises. Advantages.