article thumbnail

How gaming companies can use Amazon Redshift Serverless to build scalable analytical applications faster and easier

AWS Big Data

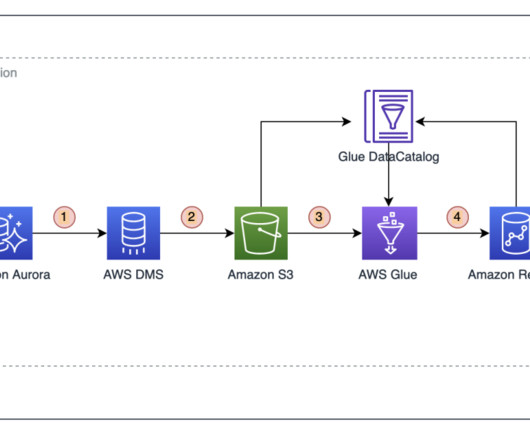
This post also discusses the art of the possible with newer innovations in AWS services around streaming, machine learning (ML), data sharing, and serverless capabilities. Data lakes are more focused around storing and maintaining all the data in an organization in one place.

article thumbnail

Navigating Data Entities, BYOD, and Data Lakes in Microsoft Dynamics

Jet Global

Now, instead of making a direct call to the underlying database to retrieve information, a report must query a so-called “data entity” instead. Each data entity provides an abstract representation of business objects within the database, such as, customers, general ledger accounts, or purchase orders. Data Lakes.

Insiders

Sign Up for our Newsletter

This site is protected by reCAPTCHA and the Google Privacy Policy and Terms of Service apply.

article thumbnail

Migrate your existing SQL-based ETL workload to an AWS serverless ETL infrastructure using AWS Glue

AWS Big Data

This solution decouples the ETL and analytics workloads from our transactional data source Amazon Aurora, and uses Amazon Redshift as the data warehouse solution to build a data mart. We use Amazon Redshift as the data warehouse to implement the data mart solution. Sumitha AP is a Sr.

Sales 52
article thumbnail

Create an end-to-end data strategy for Customer 360 on AWS

AWS Big Data

The AWS modern data architecture shows a way to build a purpose-built, secure, and scalable data platform in the cloud. Learn from this to build querying capabilities across your data lake and the data warehouse. Let’s find out what role each of these components play in the context of C360.

article thumbnail

Business Intelligence Dashboard (BI Dashboard): Best Practices and Examples

FineReport

Additionally, they provide tabs, pull-down menus, and other navigation features to assist in accessing data. Data Visualizations : Dashboards are configured with a variety of data visualizations such as line and bar charts, bubble charts, heat maps, and scatter plots to show different performance metrics and statistics.

article thumbnail

Building Better Data Models to Unlock Next-Level Intelligence

Sisense

We’re going to nerd out for a minute and dig into the evolving architecture of Sisense to illustrate some elements of the data modeling process: Historically, the data modeling process that Sisense recommended was to structure data mainly to support the BI and analytics capabilities/users.