Remove Dashboards Remove Management Remove OLAP Remove Visualization
article thumbnail

Bridge the Gap Between Reporting and Data Visualization in Power BI

Jet Global

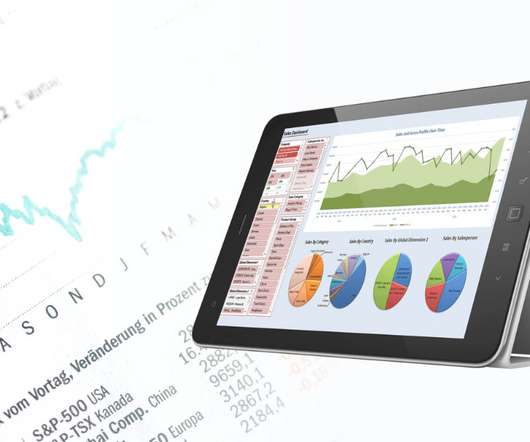
Power BI can generate easy-to-read visualizations that help stakeholders perform key analysis. For Microsoft Dynamics customers this means having up-to-date information in Power BI dashboards and the skills to make custom changes when required. Build critical reports and dashboards without relying on IT.

article thumbnail

What are decision support systems? Sifting data for better business decisions

CIO Business Intelligence

A DSS supports the management, operations, and planning levels of an organization in making better decisions by assessing the significance of uncertainties and the tradeoffs involved in making one decision over another. ERP dashboards. These systems help managers monitor performance indicators. Data-driven DSS. DSS database.

Insiders

Sign Up for our Newsletter

This site is protected by reCAPTCHA and the Google Privacy Policy and Terms of Service apply.

Trending Sources

article thumbnail

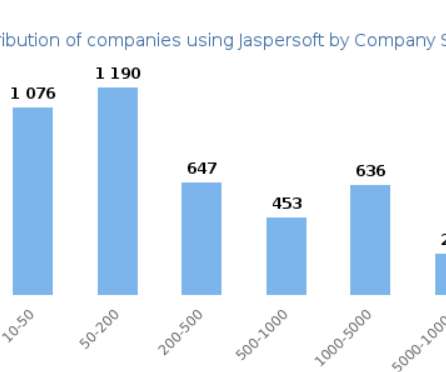
TIBCO JasperSoft for BI and Reporting

BizAcuity

TIBCO Jaspersoft offers a complete BI suite that includes reporting, online analytical processing (OLAP), visual analytics , and data integration. The web-scale platform enables users to share interactive dashboards and data from a single page with individuals across the enterprise. Online Analytical Processing (OLAP).

article thumbnail

Reporting Analytics vs. Financial Reporting: Is There a Difference?

Jet Global

As a matter of necessity, finance teams also produce financial statements for internal use by a company’s management team. Broadly speaking, these kinds of reports fall under the heading of “operational reporting”, because you use them as part of routine operations rather than as a financial management tool.

article thumbnail

Top 10 Free and Open Source BI Tools in 2020

FineReport

Although compared to the paid version, not all free BI tool provides stunning data visualization; they offer easy-to-understand charts that can meet your basic needs. Report Management . User Management . However, it lacks customization and visual effects compared to other bit tools. Query reports. HTML5 charts .

OLAP 105
article thumbnail

Business Intelligence Solutions: Every Thing You Need to Know

FineReport

Technicals such as data warehouse, online analytical processing (OLAP) tools, and data mining are often binding. On the opposite, it is more of a comprehensive application of data warehouse, OLAP, data mining, and so forth. Data visualization analysis. The designer can realize various visual effects by simplistic arrangement.

article thumbnail

Best Reporting Tools List You Can’t Miss in 2020

FineReport

Reporting tools play vital importance in transforming data into visual graphs and charts, presenting data in an attractive and intuitive manner. The former is more professional in report making, presentation, and printing, while the latter can make OLAP and predict analysis thanks to the BI capabilities. FineReport. Crystal Reports.