Remove Data Enablement Remove Demo Remove Key Performance Indicator Remove Risk
article thumbnail

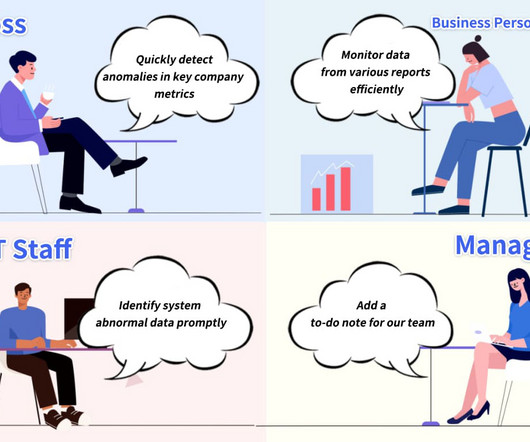
Achieve Flexible Monitoring and Notification with our Data Alert?

FineReport

Risk control and key indicator management are increasingly becoming primary concerns for modern enterprises. When key indicators show abnormal fluctuations or significant outlier values are detected in key data, it is necessary to promptly communicate risk information to business leaders for effective risk alerting.

article thumbnail

What Is An Operational Report? A Complete Guide

FineReport

Operational reports have the potential to greatly enhance business performance through the utilization of data-driven insights. These reports offer a structured and comprehensible representation of data, enabling a clearer understanding of complex issues that might otherwise remain elusive. Book a Free Demo 1.

Insiders

Sign Up for our Newsletter

This site is protected by reCAPTCHA and the Google Privacy Policy and Terms of Service apply.

Trending Sources

article thumbnail

Everything You Need to Know About Project Management Dashboard

FineReport

Project management dashboards serve as dynamic visual aids, empowering project managers to effectively track project progress, identify risks, and allocate tasks to team members efficiently. Timely Risk Identification and Mitigation: Project management dashboards facilitate the identification and management of project risks.

article thumbnail

What is Data Visualization: Complete Guide 2024

FineReport

Financial KPI Dashboard created by FineBI Book a Free Demo Another prominent player in the field of data visualization is Power BI by Microsoft. This powerful tool offers seamless integration with other Microsoft products and services, enabling users to leverage familiar environments for data analysis and visualization.