article thumbnail

What is Integrated Business Planning (IBP)?

IBM Big Data Hub

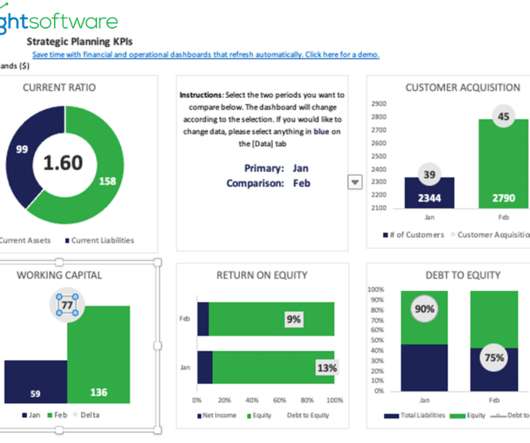
By integrating financial planning with strategic and operational planning, organizations can evaluate financial profitability, identify potential gaps or risks, and make necessary adjustments to achieve financial targets. Key performance indicators (KPIs) are established to measure progress and enable proactive management.

article thumbnail

Achieve Flexible Monitoring and Notification with our Data Alert?

FineReport

Risk control and key indicator management are increasingly becoming primary concerns for modern enterprises. When key indicators show abnormal fluctuations or significant outlier values are detected in key data, it is necessary to promptly communicate risk information to business leaders for effective risk alerting.

Insiders

Sign Up for our Newsletter

This site is protected by reCAPTCHA and the Google Privacy Policy and Terms of Service apply.

Trending Sources

article thumbnail

What Is An Operational Report? A Complete Guide

FineReport

They offer visibility and aid in tracking the performance of the business at various levels, ranging from the organization as a whole to specific departments, teams, or processes. Communicating performance : Operational reports serve as a means to communicate operational performance to stakeholders, senior management, and investors.

article thumbnail

Customize Your Enterprise-level Workstation with our Data Portal!

FineReport

It can help us better understand the market, customers, competition, risks, opportunities, and innovation. Banking Industry Scenario Description: In the banking industry, there are numerous key performance indicators (KPIs) with a high frequency of fluctuations. and FineReport 11.0. Feel free to explore it now!

article thumbnail

What is Data Lineage? Top 5 Benefits of Data Lineage

erwin

The CEO also makes decisions based on performance and growth statistics. An understanding of the data’s origins and history helps answer questions about the origin of data in a Key Performance Indicator (KPI) reports, including: How the report tables and columns are defined in the metadata? Who are the data owners?

Metadata 111
article thumbnail

Everything You Need to Know About Project Management Dashboard

FineReport

Project management dashboards serve as dynamic visual aids, empowering project managers to effectively track project progress, identify risks, and allocate tasks to team members efficiently. Timely Risk Identification and Mitigation: Project management dashboards facilitate the identification and management of project risks.

article thumbnail

Financial Dashboard: Definition, Examples, and How-tos

FineReport

A financial dashboard, one of the most important types of data dashboards , functions as a business intelligence tool that enables finance and accounting teams to visually represent, monitor, and present financial key performance indicators (KPIs).