Remove Data Enablement Remove Key Performance Indicator Remove Reporting Remove Risk
article thumbnail

What Is An Operational Report? A Complete Guide

FineReport

Operational reports have the potential to greatly enhance business performance through the utilization of data-driven insights. These reports offer a structured and comprehensible representation of data, enabling a clearer understanding of complex issues that might otherwise remain elusive.

article thumbnail

Achieve Flexible Monitoring and Notification with our Data Alert?

FineReport

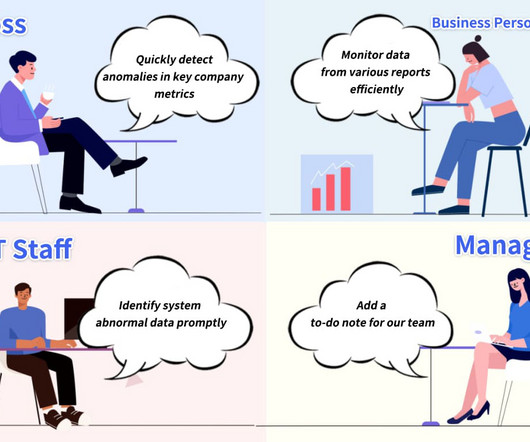
Risk control and key indicator management are increasingly becoming primary concerns for modern enterprises. When key indicators show abnormal fluctuations or significant outlier values are detected in key data, it is necessary to promptly communicate risk information to business leaders for effective risk alerting.

Insiders

Sign Up for our Newsletter

This site is protected by reCAPTCHA and the Google Privacy Policy and Terms of Service apply.

article thumbnail

Everything You Need to Know About Project Management Dashboard

FineReport

Project management dashboards serve as dynamic visual aids, empowering project managers to effectively track project progress, identify risks, and allocate tasks to team members efficiently. Project management dashboards employ a diverse range of visual elements, including graphs, charts, and other representations, to visualize project data.

article thumbnail

Take Advantage Of Operational Metrics & KPI Examples – A Comprehensive Guide

datapine

By establishing clear operational metrics and evaluate performance, companies have the advantage of using what is crucial to stay competitive in the market, and that’s data. Try our professional reporting software for 14 days, completely free! Try our professional reporting software for 14 days, completely free!

KPI 269
article thumbnail

Move Beyond Excel, PowerPoint And Static Business Reporting with Powerful Interactive Dashboards

datapine

In essence, in this post, we will explain all the details needed for dashboard reporting and creation, compare interactive vs. static reporting, and provide tips and tricks to make your business perform even better. Interactive Dashboards vs. Static Reporting. Let’s get started. What Is An Interactive Dashboard?

article thumbnail

What is Data Visualization: Complete Guide 2024

FineReport

Seamless integration ensures smooth workflows by allowing users to leverage existing infrastructure while incorporating visualizations into reports or applications seamlessly. Identification of Patterns : Visual data enables viewers to identify patterns, trends, and outliers within datasets with greater clarity.

article thumbnail

How to Choose the Best Analytics Platform, and Empower Business-Driven Analytics

Grooper

Traditional data sources like end of month statements and quarterly reports are no longer enough. Access to enterprise-wide information fuels analytics solutions and enable a new approach for decision making. It includes the reports, charts, dashboards, and terminology unique to your organization. Master data management.