Mon.Jan 04, 2021

article thumbnail

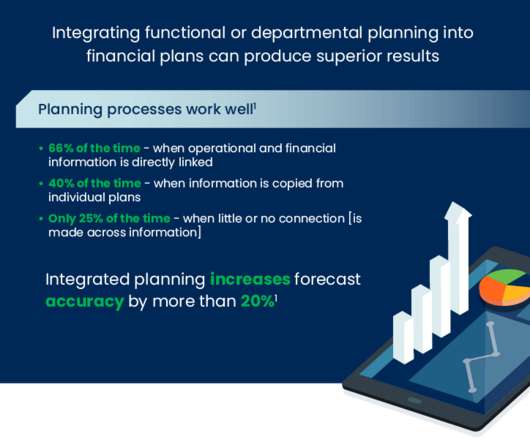
How Have Global Fluctuations Changed Your Planning Process?

Jet Global

As organizations work through their 2020 year-end closes, it’s likely that many are only now beginning to realize the full extent of the chaos inflicted by the pandemic. This isn’t surprising, though. The events of 2020 were nearly impossible to predict and almost as impossible to confidently respond to. Border shutdowns and business closures impacted sales and trade in numerous ways, just as the different government support programs had their own diverse impacts on organizational planning.
article thumbnail

9 Tips for a Seamless Transition to Data Science for Absolute Noobs!

Analytics Vidhya

ArticleVideos Overview The data science industry is growing exponentially It is important to have a clear understanding of the very basic questions before you. The post 9 Tips for a Seamless Transition to Data Science for Absolute Noobs! appeared first on Analytics Vidhya.

Insiders

Sign Up for our Newsletter

This site is protected by reCAPTCHA and the Google Privacy Policy and Terms of Service apply.

article thumbnail

Data-driven 2021: Predictions for a new year in data, analytics and AI

DataKitchen

The post Data-driven 2021: Predictions for a new year in data, analytics and AI first appeared on DataKitchen.

article thumbnail

Kaggle Grandmasters Series – Exclusive Interview with World’s First Woman 2x Kaggle Grandmaster Usha Rengaraju

Analytics Vidhya

ArticleVideos The Kaggle Grandmaster series has always tried to break a myth in each of its interviews. It is no different in this 10th. The post Kaggle Grandmasters Series – Exclusive Interview with World’s First Woman 2x Kaggle Grandmaster Usha Rengaraju appeared first on Analytics Vidhya.

Analytics 271
article thumbnail

Get Better Network Graphs & Save Analysts Time

Many organizations today are unlocking the power of their data by using graph databases to feed downstream analytics, enahance visualizations, and more. Yet, when different graph nodes represent the same entity, graphs get messy. Watch this essential video with Senzing CEO Jeff Jonas on how adding entity resolution to a graph database condenses network graphs to improve analytics and save your analysts time.

article thumbnail

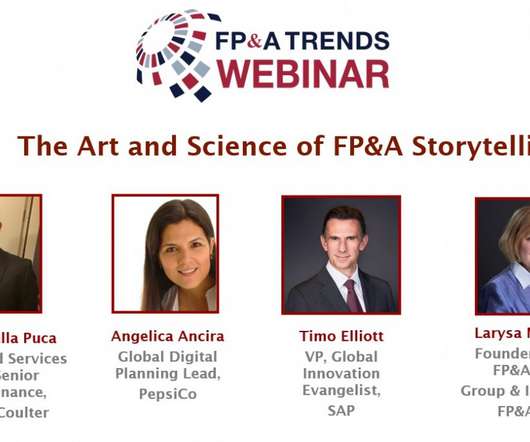
The Art and Science of FP&A Storytelling

Timo Elliott

I recently participated in a web seminar on the Art and Science of FP&A Storytelling, hosted by the founder and CEO of FP&A Research Larysa Melnychuk along with other guests Pasquale della Puca , part of the global finance team at Beckman Coulter and Angelica Ancira , Global Digital Planning Lead at PepsiCo. With advanced analytics, flexible dashboarding and effective data visualization, FP&A storytelling has become both an art and science.

article thumbnail

Simple Tricks To Up-level Your Analytics Reports.

Occam's Razor

Like you, I consume a whole lot of reports every day – company data, public data. Many are acceptable, some are very good and all the rest leave me extremely frustrated with both the ink and the think. People make so many obvious mistakes. Sometimes repeatedly. Just yesterday I was quietly seething because none of visuals included in the report contained any context to understand if the performance I was looking at was good or bad.

Reporting 113