Remove Finance Remove Interactive Remove KPI Remove Visualization
article thumbnail

Take Advantage Of Operational Metrics & KPI Examples – A Comprehensive Guide

datapine

We have written about management reporting methods that can be utilized in the modern practice of creating powerful analysis, bringing complex data into simple visuals, and employ them to make actionable decisions. Your Chance: Want to visualize & track operational metrics with ease? What Is An Operational KPI?

KPI 269
article thumbnail

Your Definitive Guide To KPI Tracking By Utilizing Modern Software & Tools

datapine

While there are numerous KPI examples you can choose from, you should pick only the most important ones and focus on the right ones for your business. That said, using the right KPIs is essential to both your immediate and long-term business activities. But first, let’s ask ourselves the question, ‘ What is KPI tracking?’.

KPI 195
Insiders

Sign Up for our Newsletter

This site is protected by reCAPTCHA and the Google Privacy Policy and Terms of Service apply.

Trending Sources

article thumbnail

KPI Dashboard: Keys To Achieve Better Performance

FineReport

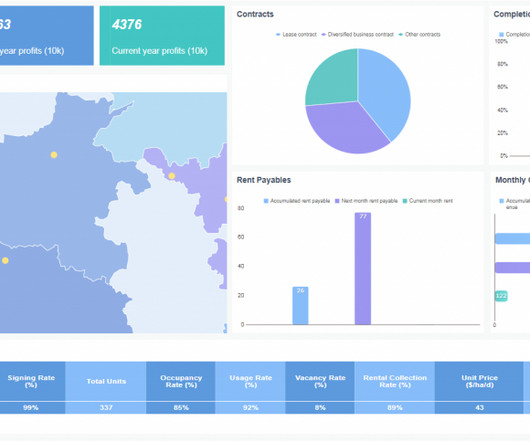
KPI dashboard releases you from your worries and troubles. What is a KPI dashboard? Definition of KPI dashboard. KPIs (Key performance indicators) are quantitative indicators used to measure the work performance of staff, being the foundation of an enterprise performance management system. Reality Use of KPI Dashboard.

KPI 52
article thumbnail

A Complete Guide To Bar Charts With Examples, Benefits, And Different Types 

datapine

2) Pros & Cons Of Bar Charts 3) When To Use A Bar Graph 4) Types Of Bar Charts 5) Bar Graphs & Charts Best Practices 6) Bar Chart Examples In today’s fast-paced analytical landscape, data visualization has become one of the most powerful tools organizations can benefit from to be successful with their analytical efforts.

article thumbnail

Your Introduction To CFO Dashboards & Reports In The Digital Age

datapine

Serving as a central, interactive hub for a host of essential fiscal information, CFO dashboards host dynamic financial KPIs and intuitive analytical tools, as well as consolidate data in a way that is digestible and improves the decision-making process. Your Chance: Want to build your own CFO dashboard completely free?

article thumbnail

Getting Started With Strategic & Operational Reports

datapine

By gaining access to highly-visual interactive insights, you can: Make swift, informed decisions, often in real-time. To put the power of operational reports into perspective, here’s one of our most efficient operational report examples for your browsing pleasure: Operational report example: Warehouse KPI dashboard.

article thumbnail

8 Examples Of Financial Reports You Can Use For Daily, Weekly, And Monthly Reports

datapine

In addition to empowering you to take a proactive approach concerning the management of your company’s finances, financial reports help assist in increasing long-term profitability through short-term financial statements. Exclusive Bonus Content: Reap the benefits of the top reports in finance! What Is A Finance Report?

Reporting 251