Remove 2017 Remove Forecasting Remove Statistics Remove Visualization
article thumbnail

What is Advanced Analytics and How Can it Advance Your Organization?

Smarten

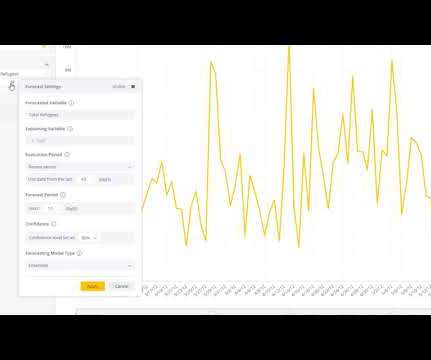
Your business users can perform advanced analytics, using sophisticated tools in an easy-to-use, drag and drop interface, with no advanced skill requirement for statistical analysis, algorithms or technical knowledge.

article thumbnail

Unleash the Power of Advanced Analytics with the Sisense Q4 2019 Release

Sisense

Data is the New Oil” was coined by The Economist in May 2017 and became a mantra for organizations to drive new wealth from data. Sisense Forecast is an advanced AI-powered forecasting option that offers unique capabilities to derive new value from data without the need for data science expertise. Talk to your data.

Insiders

Sign Up for our Newsletter

This site is protected by reCAPTCHA and the Google Privacy Policy and Terms of Service apply.

article thumbnail

Top 10 IT & Technology Buzzwords You Won’t Be Able To Avoid In 2020

datapine

Exciting and futuristic, the concept of computer vision is based on computing devices or programs gaining the ability to extract detailed information from visual images. Visual analytics: Around three million images are uploaded to social media every single day. billion in 2017 to $190.61 Artificial Intelligence (AI).

article thumbnail

Fitting Bayesian structural time series with the bsts R package

The Unofficial Google Data Science Blog

SCOTT Time series data are everywhere, but time series modeling is a fairly specialized area within statistics and data science. Forecasting (e.g. The other systems were written to do "forecasting at scale," a phrase that means something different in time series problems than in other corners of data science. by STEVEN L.

article thumbnail

What is Augmented Analytics and Why Does it Matter?

Smarten

You may also have read the recent Gartner report entitled, ‘Augmented Analytics Is the Future of Data and Analytics’ , Published 27 July 2017, by Rita L. Users can perform advanced analytics in an easy-to-use, drag and drop interface without knowledge of statistical analysis or algorithms.

article thumbnail

Adding Common Sense to Machine Learning with TensorFlow Lattice

The Unofficial Google Data Science Blog

On the one hand, basic statistical models (e.g. For example, when the prediction of an example is unexpectedly large we can trace back the prediction through visualization of the final block and identify its problematic, unexpectedly large input. linear regression, trees) can be too rigid in their functional forms.

article thumbnail

What is SSDP and Can it Truly Make Analytics Self-Serve?

Smarten

SSDP allows average business users to compile and prepare data and use that data in analytics to test hypotheses, visualize and share data, prepare reports and support day-to-day tasks with complete drill-down and drill-through capability, custom alerts and mobile access that supports the needs of every team member.