Remove 2019 Remove Dashboards Remove OLAP Remove Visualization
article thumbnail

Choosing the Reporting Tools: 5 Things You Need To Know

FineReport

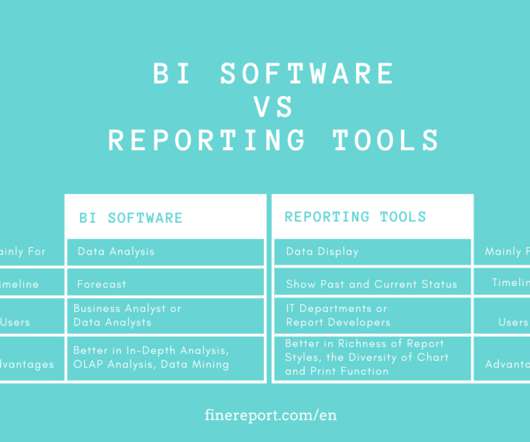
Reporting tools are the software help you extract data from the databases, and dynamically display the data in the form of tables, charts, and dashboard. Enterprise Reporting For Visualization . The KPIs can be tracked via dashboards on the TV screen in the meeting. . Does it support the complex report and rich visual effects?

article thumbnail

Enterprise Reporting: The 2020’s Comprehensive Guide

FineReport

It uses enterprise reporting tools to organize data into charts, tables, widgets, or other visualizations. The central one is the data visualization technology at the display level. And enterprise reporting is the primary data visualization technology in most enterprises. . Common Problems With Enterprise Reporting.

Insiders

Sign Up for our Newsletter

This site is protected by reCAPTCHA and the Google Privacy Policy and Terms of Service apply.

article thumbnail

CCPA 2020: Getting Your Data Landscape Ready

Octopai

Octopai’s metadata discovery and management suite provides visualization tools that empower you to see and report everything about sensitive customer data. In December 2019 a bill was introduced in the U.S. . – KPI planning – Are your dashboard key performance indicators (KPIs) telling the whole story?

article thumbnail

Pelaporan Perusahaan: Panduan Komprehensif 2020

FineReport

Analisis data adalah tentang pengekstraksian data dari data warehouse dan menganalisisnya dengan metode analisis seperti kueri, OLAP, data mining, dan visualisasi data untuk menyimpulkan data. Pada akhirnya, menampilkan wawasan data seperti laporan dan grafik visual melalui presentasi data. Dari FineReport. Dari FineReport.

OLAP 59
article thumbnail

Top 10 Free and Open Source BI Tools in 2020

FineReport

Although compared to the paid version, not all free BI tool provides stunning data visualization; they offer easy-to-understand charts that can meet your basic needs. It provides data scientists and BI executives with data mining, machine learning, and data visualization capabilities to build effective data pipelines. . From Google.

OLAP 105
article thumbnail

Best Reporting Tools List You Can’t Miss in 2020

FineReport

Reporting tools play vital importance in transforming data into visual graphs and charts, presenting data in an attractive and intuitive manner. The former is more professional in report making, presentation, and printing, while the latter can make OLAP and predict analysis thanks to the BI capabilities. FineReport. Crystal Reports.

article thumbnail

Crystal Report: Alternatif dan Perbandingannya Dengan FineReport

FineReport

Dibandingkan dengan software serupa lainnya, software-software ini dapat memperkirakan data karena teknologi analisis OLAP dan data mining-nya. Comparison between Crystal Reports and FineReport-Data visualization and Dashboard . Therefore, compared to the Crystal Report, the dashboard made by FineReport is more impressive.