Remove 2019 Remove Data mining Remove OLAP Remove Visualization
article thumbnail

Enterprise Reporting: The 2020’s Comprehensive Guide

FineReport

Enterprise reporting is a process of extracting, processing, organizing, analyzing, and displaying data in the companies. It uses enterprise reporting tools to organize data into charts, tables, widgets, or other visualizations. The central one is the data visualization technology at the display level.

article thumbnail

Choosing the Reporting Tools: 5 Things You Need To Know

FineReport

Enterprise Reporting For Visualization . As the types of charts become more diverse, and the visual effects become more impressive, traditional reporting software in the companies begins to play a role in data visualization. Does it support the complex report and rich visual effects? From FineReport. .

Insiders

Sign Up for our Newsletter

This site is protected by reCAPTCHA and the Google Privacy Policy and Terms of Service apply.

article thumbnail

Pelaporan Perusahaan: Panduan Komprehensif 2020

FineReport

Analisis data adalah tentang pengekstraksian data dari data warehouse dan menganalisisnya dengan metode analisis seperti kueri, OLAP, data mining, dan visualisasi data untuk menyimpulkan data. Pada akhirnya, menampilkan wawasan data seperti laporan dan grafik visual melalui presentasi data.

OLAP 59
article thumbnail

Top 10 Free and Open Source BI Tools in 2020

FineReport

Although compared to the paid version, not all free BI tool provides stunning data visualization; they offer easy-to-understand charts that can meet your basic needs. KNIME is an open-source BI tool specialized for data linkage, integration, and analysis. Some of the free BI tools has its paid version. Tableau Public .

OLAP 105
article thumbnail

Crystal Report: Alternatif dan Perbandingannya Dengan FineReport

FineReport

Dibandingkan dengan software serupa lainnya, software-software ini dapat memperkirakan data karena teknologi analisis OLAP dan data mining-nya. Comparison between Crystal Reports and FineReport-Data visualization and Dashboard . 2019’s Best Excel Reporting Tool that Reaches Far beyond Excel.

article thumbnail

Crystal Reports: Alternatives and Comparison with FineReport

FineReport

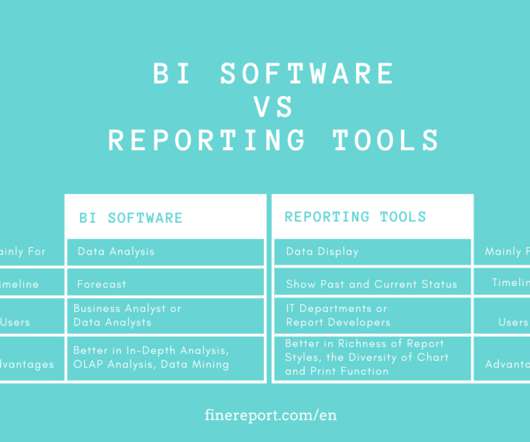
Compared to reporting tools, they can realize data forecast thanks to OLAP analysis and data mining technologies. Comparison between Crystal Reports and FineReport-Data visualization and Dashboard . Based on WebGL and other platforms, FineReport also supports rich data maps with 3D visualization effects.

article thumbnail

What Is Embedded Analytics?

Jet Global

This is in contrast to traditional BI, which extracts insight from data outside of the app. We rely on increasingly mobile technology to comb through massive amounts of data and solve high-value problems. Plus, there is an expectation that tools be visually appealing to boot. Their dashboards were visually stunning.