Remove 2023 Remove Data mining Remove Interactive Remove Visualization
article thumbnail

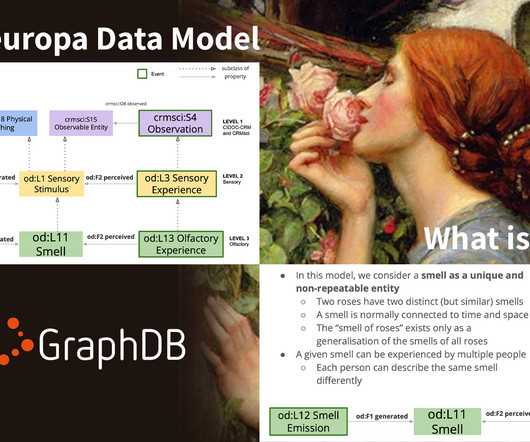
GraphDB in Action: Smells Like Semantics Spirit

Ontotext

As knowledge graphs have made their way into more and more areas of our lives through smarter search and immersive information navigation, they are also gradually turning into the default way we expect to interact with knowledge. By July 2023, it already held nearly 800.000 olfactory depictions and descriptions. van Erp, M.,

article thumbnail

10 Best Big Data Analytics Tools You Need To Know in 2023

FineReport

Having visually appealing graphics can also increase user adoption. Advanced analytics capabilities : The tool should be able to analyze data and identify patterns, as well as forecast future events with complex forecasting algorithms, going beyond simple mathematical calculations. Offers interactive and shared dashboards.

Insiders

Sign Up for our Newsletter

This site is protected by reCAPTCHA and the Google Privacy Policy and Terms of Service apply.

Trending Sources

article thumbnail

Top 10 Analytics And Business Intelligence Trends For 2020

datapine

Data exploded and became big. Spreadsheets finally took a backseat to actionable and insightful data visualizations and interactive business dashboards. The rise of self-service analytics democratized the data product chain. 2) Data Discovery/Visualization. We all gained access to the cloud.

article thumbnail

Research shows extensive use of AI contains data breaches faster and saves significant costs

IBM Big Data Hub

The Cost of a Data Breach 2023 global survey found that extensively using artificial intelligence (AI) and automation benefited organizations by saving nearly USD 1.8 million in data breach costs and accelerated data breach identification and containment by over 100 days, on average.

article thumbnail

Five open-source AI tools to know

IBM Big Data Hub

According to the 2023 State of Open Source report (this link resides outside of IBM), a notable 80% of survey respondents reported increased use of open-source software over the past year, with 41% indicating a “significant” increase. Many developers are choosing open-source AI frameworks over proprietary APIs and software.

article thumbnail

Towards optimal experimentation in online systems

The Unofficial Google Data Science Blog

However, if we experiment with both parameters at the same time we will learn something about interactions between these system parameters. Figure 4: Visualization of a central composite design. Central composite designs are made of three parts. The center part is one or more experiments in which parameters take their control (i.e.,

article thumbnail

What is IT operations analytics?

IBM Big Data Hub

And yet, CIOs say their executives believe 59% of digital initiatives take too long to complete and 52% take too long to realize value, according to a 2023 Gartner survey. It aims to understand what’s happening within a system by studying external data.

IT 60