Remove Broadcasting Remove Dashboards Remove Reporting Remove Visualization
article thumbnail

Take Advantage Of Professional Social Media Reports – Examples & Templates

datapine

Getting your socially-driven affairs in order can seem like an impossible feat, but with social media reporting, you will be able to gain the insights you need to attain the results you deserve. When you add up modern technology and a professional report tool , your reporting processes in the social realm will reap many rewards.

Reporting 178
article thumbnail

How Data Storytelling Can Build Better Customer Connections

Juice Analytics

Reporting is more than a feature of your product, it is an opportunity to remind customers of the value your solution provides. For example, Spotify’s Wrapped is an annual report sent to listeners to summarized their music habits. But what if Hubspot’s reporting had more ambitious goals than a simple data access interface?

Insiders

Sign Up for our Newsletter

This site is protected by reCAPTCHA and the Google Privacy Policy and Terms of Service apply.

Trending Sources

article thumbnail

Sport analytics leverage AI and ML to improve the game

CIO Business Intelligence

The insights are then provided to the team captain via a dashboard on Microsoft Surface devices. The great thing about the app is it’s very visual and it also has a reasonable amount of customization.” With 112,000 reports in the system and 8 million bits of information, it’s a huge amount of information for 42 clubs.”

article thumbnail

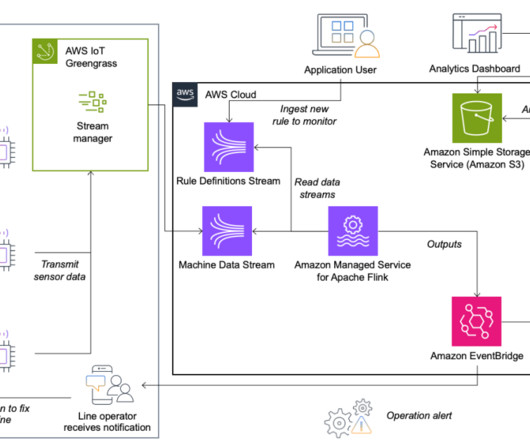
Krones real-time production line monitoring with Amazon Managed Service for Apache Flink

AWS Big Data

In this section, we dive deeper into the keyed state and broadcast state in Apache Flink and how they’re used to build the Krones rule engine. The broadcast state pattern allows the distribution of a state to all parallel instances of an operator. This means group 1 reports that everything is fine and group 2 does not.

article thumbnail

Bubble Wrap: How Eurovision Monitors Covid Risk at Events

CIO Business Intelligence

The Eurovision Song Contest, by the way, is the world’s largest live music event, organized each year in May by the local organizer and the European Broadcasting Union. Flockey provides his team with a dashboard for real-time visualization of crowd movement and risks. Social Distancing App Shows Transmission Rates in Real Time.

Risk 88
article thumbnail

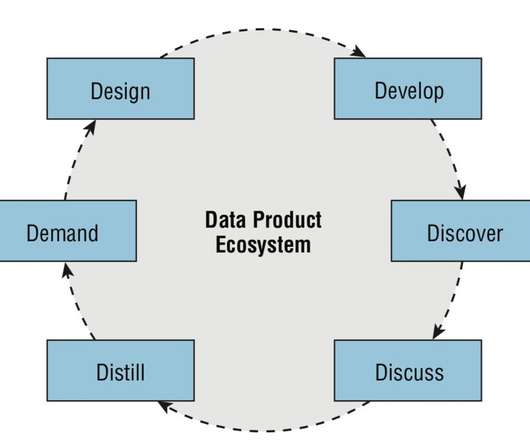
Keys to Data Fluency: Creating the Data Product Ecosystem

Juice Analytics

In fact, for most organizations, the collection of dashboards, reports, and analysis tools feels like a chaotic mess. Tools gather data, visualize the results, and distribute data products to users. In our role as dashboard and analytical application designers, this is an area that is close to home. Easier said than done.