Remove Business Analysis Remove Dashboards Remove KPI Remove Software
article thumbnail

Financial Dashboard: Definition, Examples, and How-tos

FineReport

In today’s dynamic business environment, gaining comprehensive visibility into financial data is crucial for making informed decisions. This is where the significance of a financial dashboard shines through. What is A Financial Dashboard? You can download FineReport for free and have a try!

article thumbnail

Why Dashboard Visualization Matters in the 21st century?

FineReport

Data dashboard visualization plays a key role in business, whether about analysis or decision. Now, let’s explore the dashboard visualization! What is Dashboard Visualization? dashboard visualization (by Finereport?. Benefits of data visualization dashboard software. Dashboard-Visualization-?from-Finereport?.

Insiders

Sign Up for our Newsletter

This site is protected by reCAPTCHA and the Google Privacy Policy and Terms of Service apply.

article thumbnail

Your Data Won’t Speak Unless You Ask It The Right Data Analysis Questions

datapine

Although organizations spend millions of dollars on collecting and analyzing data with various data analysis tools , it seems like most people have trouble actually using that data in actionable, profitable ways. Your Chance: Want to perform advanced data analysis with a few clicks? All of these KPI examples can be valid choices.

IT 317
article thumbnail

Reporting Solutions: A Complete Guide

FineReport

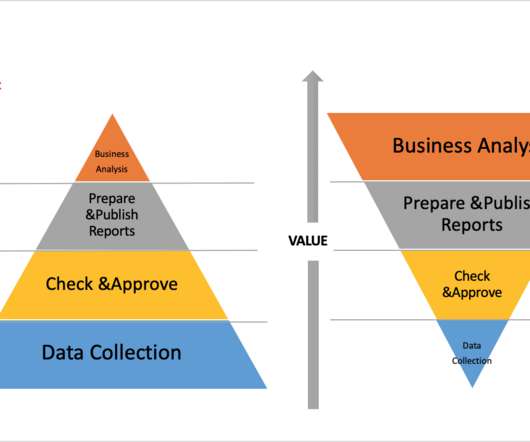
For most companies, the staffs spend 50% time on data collection, 30% time on checking and approving the data, 15% time on developing and publishing the reports, and 5% on business analysis. However, it is evident that the value of data collection for business decisions is minimal, but the value of data analysis is the greatest.

article thumbnail

Top 3 Tableau Alternatives for Data Analysis in the 21st Century

FineReport

To choose reliable tableau alternatives, we must mention Tableau Software. It was an American interactive data visualization software company of business intelligence. With the Desktop CS architecture, Tableau runs more smoothly in the design of business analysis. It suits IT staff and business personnel.

KPI 52
article thumbnail

Business Intelligence Dashboard Software: Make Business Successful

FineReport

Among amounts of intelligent choices, business intelligence(BI) dashboard software is an awesome one. BI dashboard software definition. Business intelligence dashboard is a common module that general business intelligence has to realize data visualization. Benefits of BI dashboard software .

article thumbnail

10 Best Dashboard Design Tips, Templates & How-To’s

FineReport

The most predominant means to visualize data is the application of various dashboards. The dashboard design has naturally become an important point that cannot be ignored. Many people are not very confident in designing an effective dashboard. Dashboard Design Tips. Sales dashboard by FineReport.