article thumbnail

Tableau Tip: Visualize a Single Value Against Others

Analytics Vidhya

The post Tableau Tip: Visualize a Single Value Against Others appeared first on Analytics Vidhya. Introduction How often have we all tried to compare a value against a range, with unsatisfying results? Excel is the most common tool for.

article thumbnail

Build your own Animated Data Visualization in Tableau in Just 5 Minutes

Analytics Vidhya

Overview Animated visualizations are a work of art and are really easy to create in Tableau We’ll work with open-source datasets here and create. The post Build your own Animated Data Visualization in Tableau in Just 5 Minutes appeared first on Analytics Vidhya.

Insiders

Sign Up for our Newsletter

This site is protected by reCAPTCHA and the Google Privacy Policy and Terms of Service apply.

article thumbnail

Tableau 101 – Create a Rounded Bar Chart and a Bar-in-Bar Chart in Tableau

Analytics Vidhya

ArticleVideos Objective Tableau is the gold standard for Business Analytics and Data Visualization tools in the industry Learn how to make a Rounded Bar. The post Tableau 101 – Create a Rounded Bar Chart and a Bar-in-Bar Chart in Tableau appeared first on Analytics Vidhya.

article thumbnail

Data science vs data analytics: Unpacking the differences

IBM Big Data Hub

Overview: Data science vs data analytics Think of data science as the overarching umbrella that covers a wide range of tasks performed to find patterns in large datasets, structure data for use, train machine learning models and develop artificial intelligence (AI) applications.

article thumbnail

Understanding Structured and Unstructured Data

Sisense

Structured vs unstructured data. Structured data is far easier for programs to understand, while unstructured data poses a greater challenge. However, both types of data play an important role in data analysis. Structured data. Structured data is organized in tabular format (ie.

article thumbnail

Time Series Forecasting using Microsoft Power BI

Analytics Vidhya

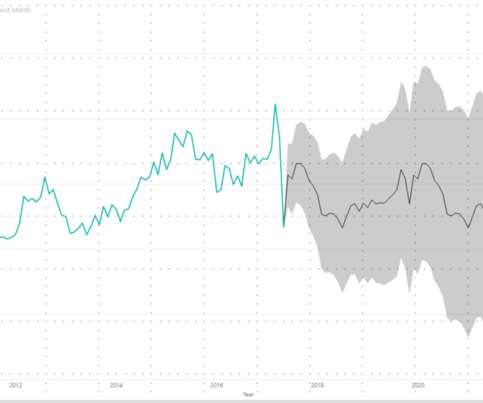
The post Time Series Forecasting using Microsoft Power BI appeared first on Analytics Vidhya. Introduction Time series forecasting is a really important area of Machine Learning as it gives you the ability to “see” ahead of time and.

article thumbnail

The Art of Storytelling in Analytics and Data Science | How to Create Data Stories?

Analytics Vidhya

The post The Art of Storytelling in Analytics and Data Science | How to Create Data Stories? appeared first on Analytics Vidhya. Introduction The idea of storytelling is fascinating; to take an idea or an incident, and turn it into a story. It brings the idea.