

KPI Dashboard during Covid and Beyond
BizAcuity
AUGUST 3, 2021
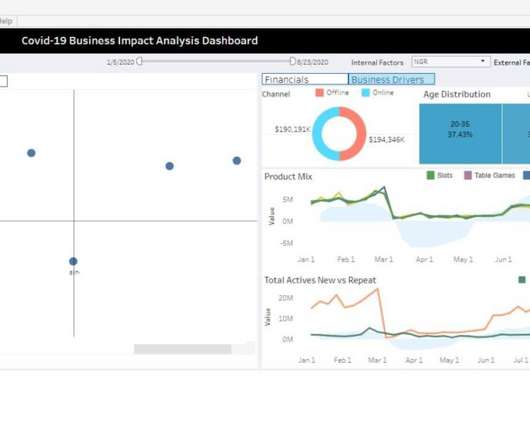
The post KPI Dashboard during Covid and Beyond appeared first on BizAcuity Solutions Pvt. Geographical spread vs change in mobility, change in industry GGR. Quadrant view of NGR vs Mobility considering product mix total activities new vs repeat.


Let's personalize your content