article thumbnail

Deep dive into the AWS ProServe Hadoop Migration Delivery Kit TCO tool

AWS Big Data

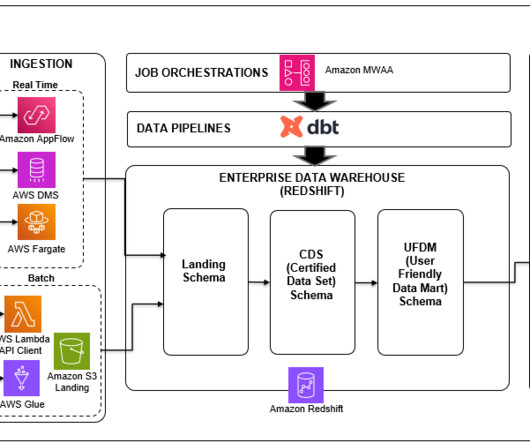
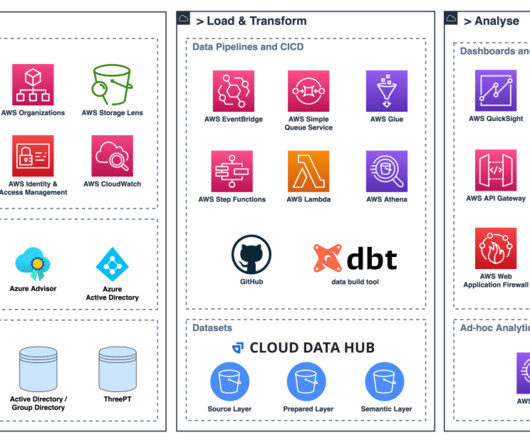
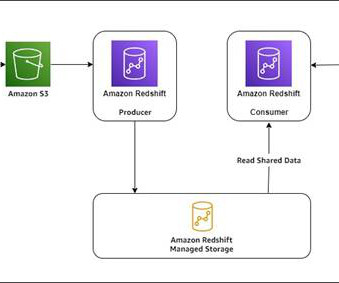
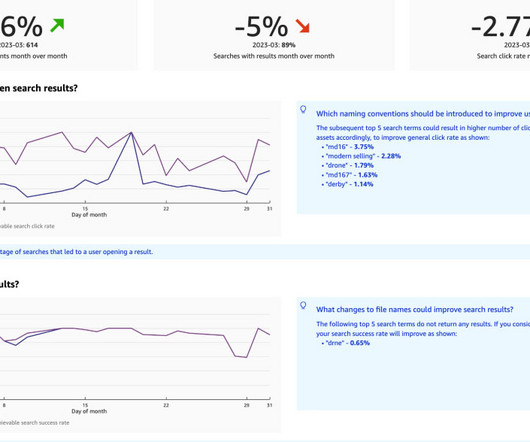
Amazon QuickSight dashboards showcase the results from the analyzer. With QuickSight, you can visualize YARN log data and conduct analysis against the datasets generated by pre-built dashboard templates and a widget. The following diagram illustrates the HMDK TCO architecture.

article thumbnail

Create a modern data platform using the Data Build Tool (dbt) in the AWS Cloud

AWS Big Data

In this post, we delve into a case study for a retail use case, exploring how the Data Build Tool (dbt) was used effectively within an AWS environment to build a high-performing, efficient, and modern data platform. It does this by helping teams handle the T in ETL (extract, transform, and load) processes.

Insiders

Sign Up for our Newsletter

This site is protected by reCAPTCHA and the Google Privacy Policy and Terms of Service apply.

article thumbnail

Introducing the AWS ProServe Hadoop Migration Delivery Kit TCO tool

AWS Big Data

The results of the log analyzer reveal Hadoop workload insights with various views and metrics of the Hadoop applications shown in Amazon QuickSight dashboards, which leads to the design of a future EMR cluster. The QuickSight timeline dashboard shows the peak time job runs because of the daily batch job.

article thumbnail

Start Thinking About DataOps

TDAN

Data is the key to unlocking insight— the secret sauce that will help you get predictive, the fuel for business intelligence. The transformative potential in AI? It relies on data. The thing that powers your CRM, your monthly report, your Tableau dashboard. The good news is that data has never […].

article thumbnail

BMW Cloud Efficiency Analytics powered by Amazon QuickSight and Amazon Athena

AWS Big Data

The CLEA dashboards were built on the foundation of the Well-Architected Lab. For more information on this foundation, refer to A Detailed Overview of the Cost Intelligence Dashboard. The difference lies in when and where data transformation takes place. These ingested datasets are used as a source in CLEA dashboards.

article thumbnail

How GamesKraft uses Amazon Redshift data sharing to support growing analytics workloads

AWS Big Data

Consequently, there was a fivefold rise in data integrations and a fivefold increase in ad hoc queries submitted to the Redshift cluster. Also, over time the number of BI dashboards (both scheduled and live) increased, which contributed to more queries being submitted to the Redshift cluster.

article thumbnail

Supercharge Your Data Lakehouse with Apache Iceberg in Cloudera Data Platform

Cloudera

These tools empower analysts and data scientists to easily collaborate on the same data, with their choice of tools and analytic engines. No more lock-in, unnecessary data transformations, or data movement across tools and clouds just to extract insights out of the data.