Remove Dashboards Remove Data Enablement Remove Data Processing Remove Visualization
article thumbnail

Your Ultimate Guide To Modern KPI Reports In The Digital Age – Examples & Templates

datapine

Typically presented in the form of an interactive dashboard , this kind of report provides a visual representation of the data associated with your predetermined set of key performance indicators – or KPI data, for short. Consider your data sources. Set up a report which you can visualize with an online dashboard.

KPI 223
article thumbnail

10 Examples of How Big Data in Logistics Can Transform The Supply Chain

datapine

Benefits Of Big Data In Logistics Before we look at our selection of practical examples and applications, let’s look at the benefits of big data in logistics – starting with the (not so) small matter of costs. Big data enables automated systems by intelligently routing many data sets and data streams.

Big Data 275
Insiders

Sign Up for our Newsletter

This site is protected by reCAPTCHA and the Google Privacy Policy and Terms of Service apply.

Trending Sources

article thumbnail

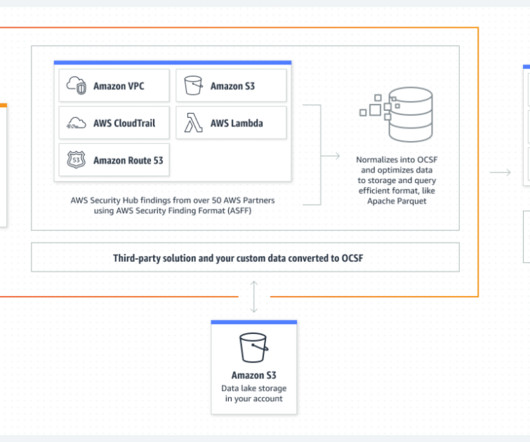
Ingest, transform, and deliver events published by Amazon Security Lake to Amazon OpenSearch Service

AWS Big Data

When it comes to near-real-time analysis of data as it arrives in Security Lake and responding to security events your company cares about, Amazon OpenSearch Service provides the necessary tooling to help you make sense of the data found in Security Lake. In OpenSearch Dashboards, choose Security in the navigation pane.

article thumbnail

13 Analytics & Business Intelligence Examples Illustrating The Value of BI

datapine

Digital data, by its very nature, paints a clear, concise, and panoramic picture of a number of vital areas of business performance, offering a window of insight that often leads to creating an enhanced business intelligence strategy and, ultimately, an ongoing commercial success. 2) Uncovering Fresh Business Insights.

article thumbnail

Move Beyond Excel, PowerPoint And Static Business Reporting with Powerful Interactive Dashboards

datapine

Soon businesses of all sizes will have so much amount of information that dashboard software will be the most invaluable resource a company can have. Visualizing the data and interacting on a single screen is no longer a luxury but a business necessity. That’s why we welcome you to the world of interactive dashboards.

article thumbnail

Buy Your Embedded Analytics and Empower Your End-Users With the Right Data

Jet Global

Application teams that embed dashboards and reports drive revenue, reduce customer churn, and differentiate their software from the competition. While embedded dashboards create real value, they can also come with real costs. The challenge is collecting all that data into one place and making it understandable.

article thumbnail

How to choose the best AI platform

IBM Big Data Hub

Decision optimization: Streamline the selection and deployment of optimization models and enable the creation of dashboards to share results, enhance collaboration and recommend optimal action plans. Visual modeling: Combine visual data science with open source libraries and notebook-based interfaces on a unified data and AI studio.