Remove Dashboards Remove Data Enablement Remove Data Warehouse Remove Visualization
article thumbnail

DataOps For Business Analytics Teams

DataKitchen

Data scientists derive insights from data while business analysts work closely with and tend to the data needs of business units. Business analysts sometimes perform data science, but usually, they integrate and visualize data and create reports and dashboards from data supplied by other groups.

article thumbnail

Exploring real-time streaming for generative AI Applications

AWS Big Data

Streaming data facilitates the constant flow of diverse and up-to-date information, enhancing the models’ ability to adapt and generate more accurate, contextually relevant outputs. OpenSearch Service offers visualization capabilities powered by OpenSearch Dashboards and Kibana (1.5 versions).

Insiders

Sign Up for our Newsletter

This site is protected by reCAPTCHA and the Google Privacy Policy and Terms of Service apply.

article thumbnail

Amazon Redshift announcements at AWS re:Invent 2023 to enable analytics on all your data

AWS Big Data

In 2013, Amazon Web Services revolutionized the data warehousing industry by launching Amazon Redshift , the first fully-managed, petabyte-scale, enterprise-grade cloud data warehouse. Amazon Redshift made it simple and cost-effective to efficiently analyze large volumes of data using existing business intelligence tools.

article thumbnail

Improve healthcare services through patient 360: A zero-ETL approach to enable near real-time data analytics

AWS Big Data

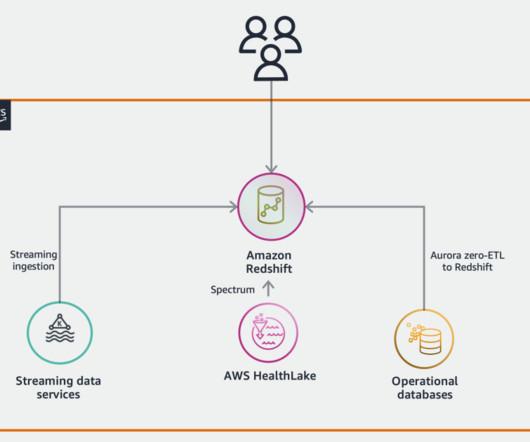
This means you can seamlessly combine information such as clinical data stored in HealthLake with data stored in operational databases such as a patient relationship management system, together with data produced from wearable devices in near real-time. We use on-demand capacity mode.

article thumbnail

The Gartner 2021 Leadership Vision for Data & Analytics Leaders Webinar Q&A

Andrew White

As such any Data and Analytics strategy needs to incorporate data sovereignty as per of its D&A governance program. Coding skills – SQL, Python or application familiarity – ETL & visualization? See recorded webinars: Emerging Practices for a Data-driven Strategy. Link Data to Business Outcomes.

article thumbnail

Building a Functional Ecosystem: Nine Ways to Boost Your Finance-Tax Synergy

Jet Global

CXO seamlessly builds C-Level reports and dashboards against your Longview tax data, enabling you to present data in a more digestible format. Increased Visualization Sophistication. The potential of your data is continually evolving. Enhancing C-Level Reporting.

Finance 52
article thumbnail

What is a Data Pipeline?

Jet Global

A data pipeline is a series of processes that move raw data from one or more sources to one or more destinations, often transforming and processing the data along the way. Data pipelines support data science and business intelligence projects by providing data engineers with high-quality, consistent, and easily accessible data.