article thumbnail

Enhance monitoring and debugging for AWS Glue jobs using new job observability metrics, Part 3: Visualization and trend analysis using Amazon QuickSight

AWS Big Data

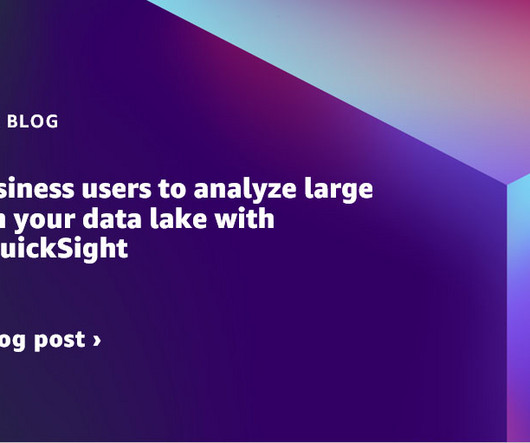
Grafana provides powerful customizable dashboards to view pipeline health. QuickSight makes it straightforward for business users to visualize data in interactive dashboards and reports. QuickSight makes it straightforward for business users to visualize data in interactive dashboards and reports.

Metrics 101
article thumbnail

Data Engineering for Streaming Data on GCP

Analytics Vidhya

Introduction Companies can access a large pool of data in the modern business environment, and using this data in real-time may produce insightful results that can spur corporate success. Real-time dashboards such as GCP provide strong data visualization and actionable information for decision-makers.

Insiders

Sign Up for our Newsletter

This site is protected by reCAPTCHA and the Google Privacy Policy and Terms of Service apply.

article thumbnail

Centralize near-real-time governance through alerts on Amazon Redshift data warehouses for sensitive queries

AWS Big Data

Amazon Redshift is a fully managed, petabyte-scale data warehouse service in the cloud that delivers powerful and secure insights on all your data with the best price-performance. With Amazon Redshift, you can analyze your data to derive holistic insights about your business and your customers.

article thumbnail

Manage your data warehouse cost allocations with Amazon Redshift Serverless tagging

AWS Big Data

Amazon Redshift Serverless makes it simple to run and scale analytics without having to manage your data warehouse infrastructure. In Cost Explorer, you can visualize daily, monthly, and forecasted spend by combining an array of available filters. Michael Yitayew is a Product Manager for Amazon Redshift based out of New York.

article thumbnail

Financial Dashboard: Definition, Examples, and How-tos

FineReport

In today’s dynamic business environment, gaining comprehensive visibility into financial data is crucial for making informed decisions. This is where the significance of a financial dashboard shines through. What is A Financial Dashboard? You can download FineReport for free and have a try! Free Download of FineReport 1.

article thumbnail

How to enable Cloudera Data Visualization in CDW

Cloudera

In our previous blog post we introduced Cloudera Data Visualization in Cloudera Data Warehouse (CDW) available in tech preview, in CDP Public Cloud. This blog will help you get started with Cloudera Data Visualization, so you can start building interesting and powerful applications on all types of data.

article thumbnail

Automate deployment of an Amazon QuickSight analysis connecting to an Amazon Redshift data warehouse with an AWS CloudFormation template

AWS Big Data

Amazon Redshift is the most widely used data warehouse in the cloud, best suited for analyzing exabytes of data and running complex analytical queries. Amazon QuickSight is a fast business analytics service to build visualizations, perform ad hoc analysis, and quickly get business insights from your data.