Remove Dashboards Remove Data Enablement Remove Optimization Remove Visualization
article thumbnail

What is Data Visualization: Complete Guide 2024

FineReport

What is Data Visualization Understanding the Concept Data visualization, in simple terms, refers to the presentation of data in a visual format. By utilizing visual elements, data visualization allows individuals to grasp difficult concepts or identify new patterns within the data.

article thumbnail

Exploring Data Wonders: Data Visualization Examples & Considerations

FineReport

As the realm of data visualization undergoes rapid proliferation, diversifying applications, and evolving presentation formats, its expansive landscape unfolds. Mirroring the growth seen in other emerging concepts, the boundaries of data visualization remain in a state of continual expansion and is vital when you generate reports.

Insiders

Sign Up for our Newsletter

This site is protected by reCAPTCHA and the Google Privacy Policy and Terms of Service apply.

Trending Sources

article thumbnail

Everything You Need to Know About Project Management Dashboard

FineReport

Thus, one tool that has gained significant popularity in recent years is the Project Management Dashboard. Moreover, the implementation of an effective Project Management Dashboard facilitates data-driven decision-making and sustainable business success. What Is A Project Management Dashboard?

article thumbnail

10 Examples of How Big Data in Logistics Can Transform The Supply Chain

datapine

Table of Contents 1) Benefits Of Big Data In Logistics 2) 10 Big Data In Logistics Use Cases Big data is revolutionizing many fields of business, and logistics analytics is no exception. The complex and ever-evolving nature of logistics makes it an essential use case for big data applications.

Big Data 275
article thumbnail

Take Advantage Of Operational Metrics & KPI Examples – A Comprehensive Guide

datapine

We have written about management reporting methods that can be utilized in the modern practice of creating powerful analysis, bringing complex data into simple visuals, and employ them to make actionable decisions. Your Chance: Want to visualize & track operational metrics with ease?

KPI 269
article thumbnail

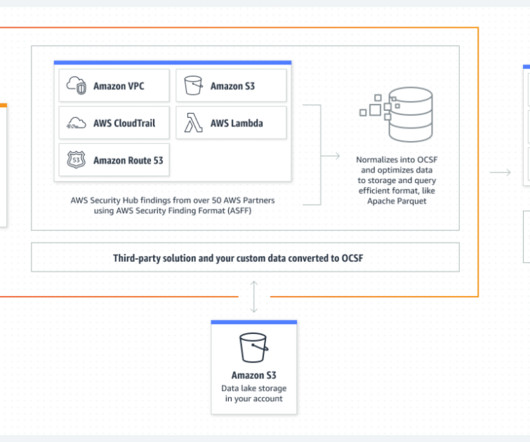
Ingest, transform, and deliver events published by Amazon Security Lake to Amazon OpenSearch Service

AWS Big Data

When it comes to near-real-time analysis of data as it arrives in Security Lake and responding to security events your company cares about, Amazon OpenSearch Service provides the necessary tooling to help you make sense of the data found in Security Lake. In OpenSearch Dashboards, choose Security in the navigation pane.

article thumbnail

The Impact of Healthcare BI Tools on Decision-Making and Patient Care

FineReport

Optimized Operational Efficiency: These tools streamline processes and resource allocation, leading to cost savings and improved resource utilization. Through real-time data analysis and predictive insights, clinicians can tailor treatment approaches to individual patient requirements, fostering a personalized approach to care delivery.