Remove Dashboards Remove Data Warehouse Remove Reporting Remove Snapshot
article thumbnail

Manage your data warehouse cost allocations with Amazon Redshift Serverless tagging

AWS Big Data

Amazon Redshift Serverless makes it simple to run and scale analytics without having to manage your data warehouse infrastructure. In AWS Cost Explorer , you want to create cost reports for Redshift Serverless by department, environment, and cost center. Create cost reports. View and edit tags.

article thumbnail

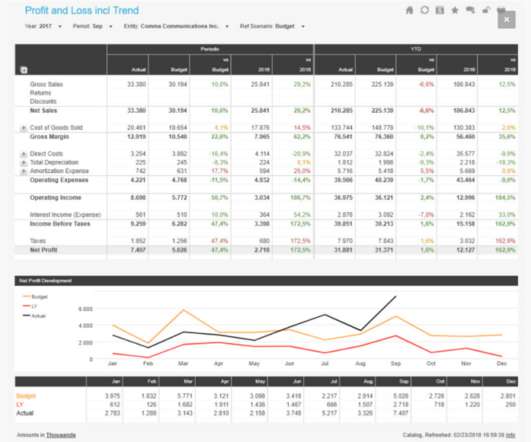
Financial Dashboard: Definition, Examples, and How-tos

FineReport

In today’s dynamic business environment, gaining comprehensive visibility into financial data is crucial for making informed decisions. This is where the significance of a financial dashboard shines through. What is A Financial Dashboard? These reports include the cash flow statement, income statement, and balance sheet.

Insiders

Sign Up for our Newsletter

This site is protected by reCAPTCHA and the Google Privacy Policy and Terms of Service apply.

article thumbnail

Laminar Scales Enterprise Data Security Platform With New Management Features

Laminar Security

“Clearly organizations are needing a more scalable, sustainable approach to discovering and governing cloud data.” To achieve comprehensive large enterprise cloud data management, a DSPM must include summarized global data risk reporting as well as drilled-down views based on data sensitivity, security posture or other factors.

article thumbnail

Financial Intelligence vs. Business Intelligence: What’s the Difference?

Jet Global

A new paradigm in reporting and analysis is emerging. There was always a delay between the events being recorded in financial systems (for example, the purchase of a product or service) and the ability to put that information in context and draw useful conclusions from it (for example, a weekly sales report).

article thumbnail

Best 10 Dashboard Reporting Tools You Can’t Miss

FineReport

Dashboard reporting refers to putting the relevant business metrics and KPIs in one interface, presenting them visually, dynamic, and in real-time, in the dashboard formats. This article will review the best 10 dashboard tools covering different areas, including open source and free software. What Makes a Great Dashboard?

article thumbnail

Enable Multi-AZ deployments for your Amazon Redshift data warehouse

AWS Big Data

Amazon Redshift is a fully managed, petabyte scale cloud data warehouse that enables you to analyze large datasets using standard SQL. Data warehouse workloads are increasingly being used with mission-critical analytics applications that require the highest levels of resilience and availability.

article thumbnail

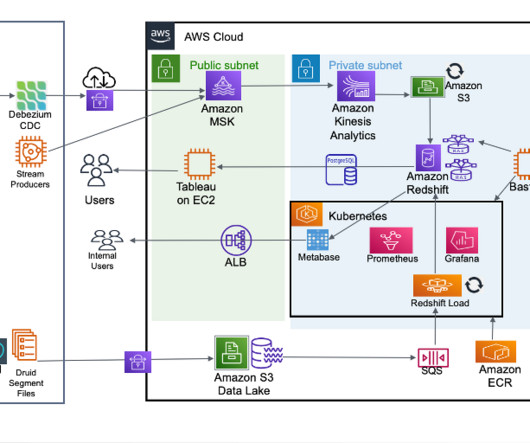
How Gupshup built their multi-tenant messaging analytics platform on Amazon Redshift

AWS Big Data

Objective Gupshup wanted to build a messaging analytics platform that provided: Build a platform to get detailed insights, data, and reports about WhatsApp/SMS campaigns and track the success of every text message sent by the end customers. Additionally, extract, load, and transform (ELT) data processing is sped up and made easier.