Remove Dashboards Remove Informatics Remove Publishing Remove Visualization
article thumbnail

Reporting System: Everything You Need to Know

FineReport

With the development of enterprise informatization, there are more and more kinds of data produced, and the demand for reports surges day by day. The data analysis part is responsible for extracting data from the data warehouse, using the query, OLAP, data mining to analyze data, and forming the data conclusion with data visualization.

article thumbnail

Daily Sales Report: Definition, Samples, Key Elements, and How-tos

FineReport

In order to meet the requirements on the style and design of reports in different scenarios, FineReport supports three different types of reports: Normal Report, Dashboard and Aggregation Report, which can generally cover different needs from different working scenarios. These reports are all produced by FineReport.

Sales 52
Insiders

Sign Up for our Newsletter

This site is protected by reCAPTCHA and the Google Privacy Policy and Terms of Service apply.

Trending Sources

article thumbnail

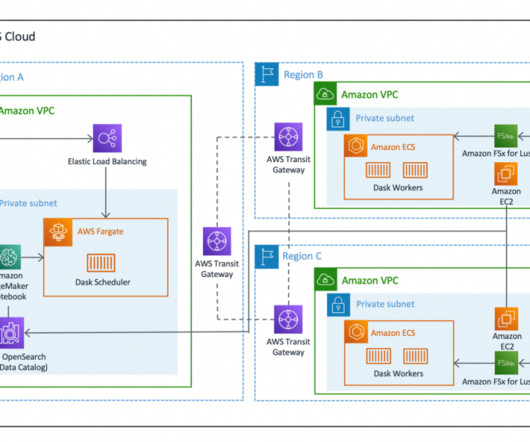
Build efficient, cross-Regional, I/O-intensive workloads with Dask on AWS

AWS Big Data

Solution overview Each day, the UK Met Office produces up to 300 TB of weather and climate data, a portion of which is published to ASDI. System administrators have access to the built-in Dask dashboard exposed via an Elastic Load Balancer. How could we publish an IP address, which is capable of changing, across AWS Regions?

article thumbnail

Free Daily Report Template, Help you dramatically Streamline Your Reporting Process

FineReport

There are three key points: automatic data extraction, automatic generation of daily report template and automatic publishing of reports. How to automatically generate daily report templates for direct application in the future? How to automatically publish or send the daily report after the report is completed?

article thumbnail

Top 10 Key Features of BI Tools in 2020

FineReport

They prefer self-service development, interactive dashboards, and self-service data exploration. On the one hand, governments, Internet companies, and large enterprises attach great importance to informatization construction and require separate maintenance. Analytics dashboards. Interactive visual exploration.