Remove Dashboards Remove Informatics Remove Strategy Remove Visualization
article thumbnail

Performance Dashboard: Facilitate The Performance of Your Business

FineReport

Performance dashboard can help you deal with various business problems. What is a performance dashboard? Companies can use performance dashboards to guide various indicators, ranging from checking the ability of a department to monitoring the availability of business strategies for global organizations.

article thumbnail

Business Intelligence System: Definition, Application & Practice

FineReport

Through this way, it can support current corporate analysis and future decision or strategy making. Data Visualization. Data visualization can reflect business operations intuitively. Then further make business decisions and strategies based on previous moves. DASHBOARD REPORTING (by FineReport). Data Warehouse.

Insiders

Sign Up for our Newsletter

This site is protected by reCAPTCHA and the Google Privacy Policy and Terms of Service apply.

article thumbnail

Top 10 Key Features of BI Tools in 2020

FineReport

They prefer self-service development, interactive dashboards, and self-service data exploration. On the one hand, governments, Internet companies, and large enterprises attach great importance to informatization construction and require separate maintenance. Analytics dashboards. Interactive visual exploration.

article thumbnail

The 9 most in-demand IT jobs in healthcare

CIO Business Intelligence

Informatics is a top priority, driving a demand for skills such as SQL, Python, data analysis, project management, process improvement, and more. In a healthcare setting, a business intelligence developer will have a focus on building dashboards and reports related to healthcare data.

article thumbnail

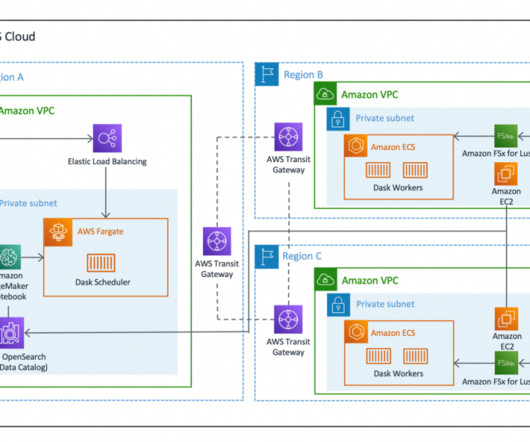
Build efficient, cross-Regional, I/O-intensive workloads with Dask on AWS

AWS Big Data

System administrators have access to the built-in Dask dashboard exposed via an Elastic Load Balancer. ERA5 ( historic_temp_regridded ) us-east-1 1512 711 427 202 Difference ( propogated pool ) us-west-2 and us-east-1 1527 906 469 251 The following graph visualizes the performance and scale.