Remove Data Analytics Remove Data Processing Remove Management Remove Snapshot
article thumbnail

Implement data warehousing solution using dbt on Amazon Redshift

AWS Big Data

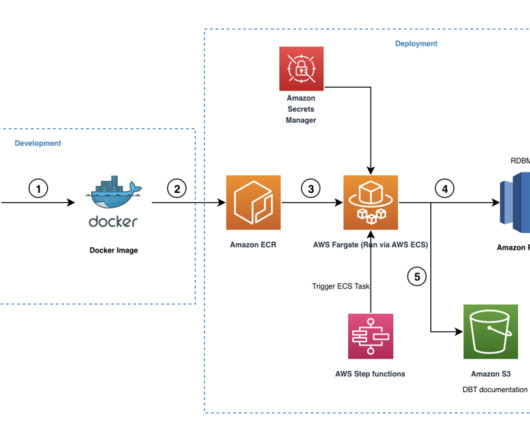
Amazon Redshift is a cloud data warehousing service that provides high-performance analytical processing based on a massively parallel processing (MPP) architecture. Building and maintaining data pipelines is a common challenge for all enterprises. All the connection profiles are configured within the dbt profiles.yml file.

article thumbnail

Your Introduction To CFO Dashboards & Reports In The Digital Age

datapine

Serving as a central, interactive hub for a host of essential fiscal information, CFO dashboards host dynamic financial KPIs and intuitive analytical tools, as well as consolidate data in a way that is digestible and improves the decision-making process. We offer a 14-day free trial. What Is A CFO Dashboard?

Insiders

Sign Up for our Newsletter

This site is protected by reCAPTCHA and the Google Privacy Policy and Terms of Service apply.

article thumbnail

Break data silos and stream your CDC data with Amazon Redshift streaming and Amazon MSK

AWS Big Data

Redshift streaming ingestion provides low latency, high-throughput data ingestion, which enables customers to derive insights in seconds instead of minutes. After that, using materialized-view refresh, you can ingest hundreds of megabytes of data per second. This solution uses Amazon Aurora MySQL hosting the example database salesdb.

article thumbnail

10 Examples of How Big Data in Logistics Can Transform The Supply Chain

datapine

Table of Contents 1) Benefits Of Big Data In Logistics 2) 10 Big Data In Logistics Use Cases Big data is revolutionizing many fields of business, and logistics analytics is no exception. The complex and ever-evolving nature of logistics makes it an essential use case for big data applications. million miles.

Big Data 275
article thumbnail

Utilize The Effectiveness Of Professional Executive Dashboards & Reports

datapine

Without big data analytics, companies are blind and deaf, wandering out onto the Web like deer on a freeway. Companies that use data analytics are five times more likely to make faster decisions, based on a survey conducted by Bain & Company. Management KPI Dashboard. click to enlarge**.

article thumbnail

Best Dashboard Ideas & Design Examples To Boost Your Business Success

datapine

The ability to monitor, visualize, and analyze relevant data gives today’s businesses, across a host of sectors, the power to understand their prospects, make informed decisions, increase efficiencies, and work towards a set of rewarding long term goals. 3) Management KPI Dashboard. 1) Marketing KPI Dashboard.

article thumbnail

Take Advantage Of The Top 16 Sales Graphs And Charts To Boost Your Business

datapine

All else being equal, a shorter sales cycle is better, and so this graph’s ability to compare your different sales managers/representatives closing rates can show you who your top performers are. Just make sure to see the size of the deals your managers are closing, and keep track of the CLV of those customers. click to enlarge**.

Sales 235