Remove Data-driven Remove Interactive Remove Key Performance Indicator Remove Visualization
article thumbnail

Elevating Healthcare Staffing: From Spreadsheet Chaos to Data-Driven Decisions  

InsightOut

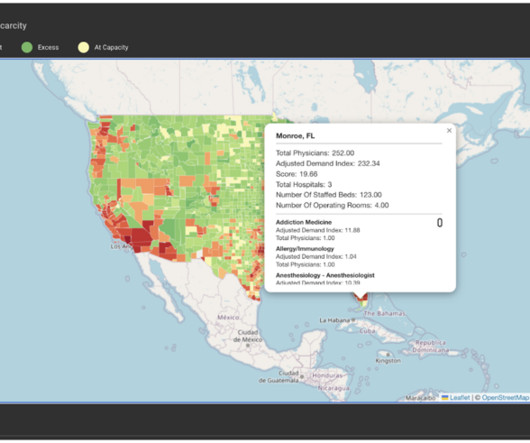
Challenging the Status Quo with Data Insights Historically, Caliber, like many organizations, relied heavily on Microsoft Excel for data management and analysis. Key Outcomes and Benefits National and Granular Insights: The map provides a clear visual representation of physician demand across the U.S.,

article thumbnail

6 ways generative AI can optimize asset management

IBM Big Data Hub

These foundation models, built on large language models, are trained on vast amounts of unstructured and external data. They can generate responses like text and images, while simultaneously interpreting and manipulating existing data. They require job plans and work instructions for asset failures and repairs.

Insiders

Sign Up for our Newsletter

This site is protected by reCAPTCHA and the Google Privacy Policy and Terms of Service apply.

Trending Sources

article thumbnail

An Introduction To Data Dashboards: Meaning, Definition & Industry Examples

datapine

“It is a capital mistake to theorize before one has data.”– Data is all around us. Data has changed our lives in many ways, helping to improve the processes, initiatives, and innovations of organizations across sectors through the power of insight. Let’s kick things off by asking the question: what is a data dashboard?

article thumbnail

Your Ultimate Guide To Modern KPI Reports In The Digital Age – Examples & Templates

datapine

Experts predict that by 2025, around 175 Zettabytes of data will be generated annually, according to research from Seagate. But with so much data available from an ever-growing range of sources, how do you make sense of this information – and how do you extract value from it? Looking for a bite-sized introduction to reporting?

KPI 223
article thumbnail

Your Definitive Guide To Building Valuable Narratives Through Data Storytelling

datapine

By gaining centralized access to business data and presenting it in a visual way that follows a logical path and provides invaluable insights on a particular area or subject, you stand to set yourself apart from your competitors and become a leader in your field. Exclusive Bonus Content: Your definitive guide to data storytelling!

KPI 193
article thumbnail

Everything You Need To Know About Static, Dynamic & Real Time Reporting

datapine

In the digital age, great businesses are founded on great insight — the data-driven kind. Without access to valuable business data, regardless of your niche and sector, you’ll merely be shooting in the dark when making key commercial decisions. But data is only valuable if you know how to handle it effectively.

Reporting 109
article thumbnail

SaaS Dashboard Examples For Modern Business Management Practices

datapine

If you’re part of a growing SaaS company and are looking to accelerate your success, leveraging the power of data is the way to gain a real competitive edge. Data analysis like never before. Compiling analysis results with the help of interactive dashboards and charts is one of the main features SaaS solution can offer.