Remove Data Processing Remove Interactive Remove KPI Remove Technology
article thumbnail

How To Improve Your Facility Management With Healthcare Reports

datapine

Rapid technological evolution means it’s now possible to use accessible and intuitive data-driven tools to our advantage. By utilizing interactive digital dashboards, it’s possible to leverage data to transform metrics into actionable insights to spot weaknesses, identify strengths, and predict events before they occur.

Reporting 198
article thumbnail

An Introduction To Data Dashboards: Meaning, Definition & Industry Examples

datapine

Data dashboards provide a centralized, interactive means of monitoring, measuring, analyzing, and extracting a wealth of business insights from relevant datasets in several key areas while displaying aggregated information in a way that is both intuitive and visual. They Are Interactive. What Is A Data Dashboard? click to enlarge**.

Insiders

Sign Up for our Newsletter

This site is protected by reCAPTCHA and the Google Privacy Policy and Terms of Service apply.

Trending Sources

article thumbnail

SaaS Dashboard Examples For Modern Business Management Practices

datapine

In the Age of Information, digital technologies have evolved to such an extent that a wealth of tools, applications, and platforms exists to enhance the way businesses operate in a number of areas. A SaaS dashboard is a powerful business intelligence tool that offers a host of benefits for ambitious tech businesses.

article thumbnail

Take Advantage Of Mobile Dashboards – Examples & Selected Designs

datapine

Mobile technology has changed the way we interact with the world around us, and when it comes to analyzing valuable business insights, mobile dashboards offer the freedom and flexibility to turn stats into success while you’re on the go. Exclusive Bonus Content: Why Is Mobile Important? What Is A Mobile Dashboard?

article thumbnail

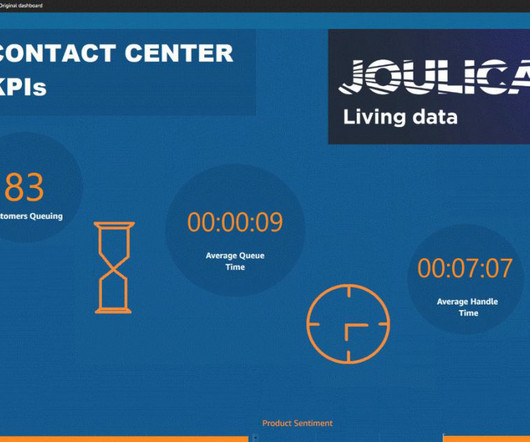
Joulica unifies real-time and historical customer experience analytics with Amazon QuickSight

AWS Big Data

Our founders previously led contact center research and development for a global contact center technology provider, and we founded Joulica because we saw that the shift to the cloud and growing demand for data and analytics would transform the customer service industry. To learn more about Joulica, please visit Joulica.io.

article thumbnail

8 Examples Of Financial Reports You Can Use For Daily, Weekly, And Monthly Reports

datapine

These reports are more digestible when they are generated through online data visualization tools that have numerous interactive dashboard features, to ensure that your business has the right meaningful financial data. a) Cash Management Financial Report Template And KPIs. **click to enlarge**. d) Financial KPI Dashboard And KPIs.

Reporting 251
article thumbnail

Leveraging digital disruption to transform customer experience

CIO Business Intelligence

Disruption driven by evolving digital technology will remain a key business challenge this year and reshape customer expectations. CIO and Adobe recently hosted a senior IT roundtable to address the challenges and solutions. What I’m hearing is it’s around what are your KPIs [key performance indicators]”, Starrett said in response.