Remove Download Remove Metrics Remove Scorecard Remove Visualization
article thumbnail

Build Up Your Performance With KPI Scorecards – Examples & Templates

datapine

Tracking the success metrics based on your needs, and the time frame you select while comparing your values can be done with simple yet effective scorecards. Download right here our bite-sized guide and start creating your reports! What Is A KPI Scorecard? The Benefits & Features Of Scorecards.

Scorecard 226
article thumbnail

Automating Model Risk Compliance: Model Monitoring

DataRobot Blog

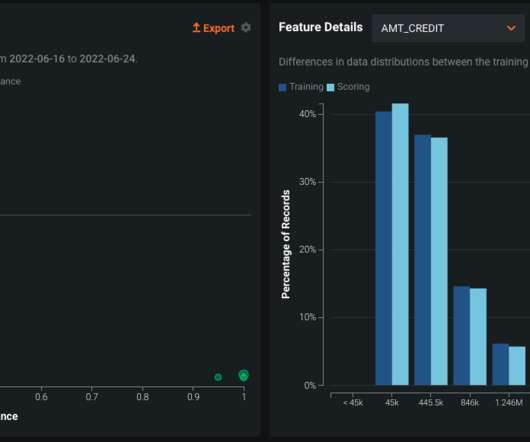
Monitoring Model Metrics. With this data in hand, we are able to measure both the data drift and model performance, both of which are essential metrics in measuring the health of the deployed model. The accuracy of a model is another essential metric that informs us about its health in a deployed setting.

Risk 59
Insiders

Sign Up for our Newsletter

This site is protected by reCAPTCHA and the Google Privacy Policy and Terms of Service apply.

article thumbnail

13 power tips for Microsoft Power BI

CIO Business Intelligence

Power BI is Microsoft’s interactive data visualization and analytics tool for business intelligence (BI). With Power BI, you can pull data from almost any data source and create dashboards that track the metrics you care about the most. Power BI’s rich reports or dashboards can be embedded into reporting portals you already use.

article thumbnail

Google Analytics Tips: 10 Data Analysis Strategies That Pay Off Big!

Occam's Razor

Bonus: Download the All Traffic Source End to End report for best, in depth, analysis. Download this custom report: Landing Pages Analysis. This post is about standard GA reports, but the standard cart/checkout funnel visualization in GA is value deficient. Change the metric on top of the page to Goal Values and bam!

Strategy 159
article thumbnail

Google Analytics Tutorial: 8 Valuable Tips To Hustle With Data!

Occam's Razor

Produce built-in visualization magic. Update: If you would like to download the above mentioned dashboard into your Google Analytics account please click on this link: VP Social Media Performance Dashboard.]. My preferred path is to leverage the tool's built-in features for filtering/visualizing the data. Not today.

Analytics 145
article thumbnail

Be Real-World Smart: A Beginner's Advanced Google Analytics Guide

Occam's Razor

Along the way I'll share some of my favourite metrics and analytics best practices that should accelerate your path to becoming a true Analysis Ninja. At this point you'll be a little confused about some metric or the other. Go, read one of the best pages in the Analytics help center: Understanding Dimensions and Metrics.

Analytics 109