Sun.Mar 17, 2024

article thumbnail

Create Your First Game with Python: Snake Game

Analytics Vidhya

Python is both fun and straightforward to use. With a wide range of libraries available, Python makes our lives easier by simplifying the creation of games and applications. In this article, we’ll create a classic game that many of us have likely played at some point in our lives – the snake game. If you […] The post Create Your First Game with Python: Snake Game appeared first on Analytics Vidhya.

Analytics 296
article thumbnail

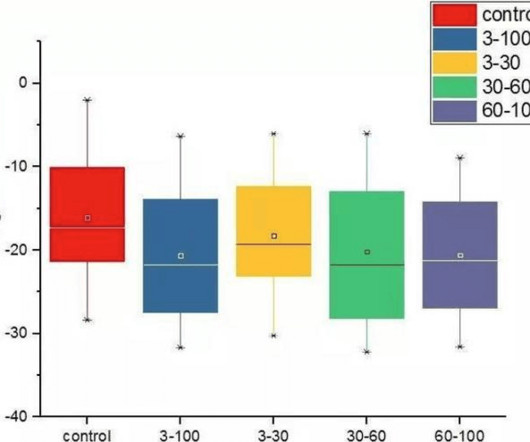
Mastering Boxplots: Meaning, Reading and Creating

FineReport

The boxplot, also known as a box-and-whisker plot, is a commonly used chart type in daily work and research. While most are familiar with bar charts, line graphs, pie charts, scatter plots, and Gantt charts , creating professional reports often requires utilizing more specialized and practical chart types like the boxplot. Today, let’s explore the boxplot, which contains several elements and may seem somewhat complex to use.

Insiders

Sign Up for our Newsletter

This site is protected by reCAPTCHA and the Google Privacy Policy and Terms of Service apply.

article thumbnail

The Perfect Duo: Impact of Generative AI on Online Trading

Analytics Vidhya

Introduction From Alan Turing’s “Computing Machinery and Intelligence,” which introduced the seminal concept of The Imitation Game, to the remarkable achievements of Devin AI – the world’s foremost fully autonomous AI software engineer – the journey in advancing artificial intelligence has been extraordinary. Artificial intelligence (AI) has made significant inroads across various sectors such as […] The post The Perfect Duo: Impact of Generative AI on O

Software 265
article thumbnail

How to Create Courses Within Minutes Using EverLearns

Analytics Vidhya

Introduction Are you tired of spending hours creating a course outline from scratch? Look no further, as EverLearns is here to revolutionize the way you generate course outlines. Bid farewell to manual outlining and welcome streamlined course creation. Whether you’re an educator, trainer, or instructional designer, EverLearns offers you seamless operation, customization options, and collaborative […] The post How to Create Courses Within Minutes Using EverLearns appeared first on Ana

Analytics 242
article thumbnail

Get Better Network Graphs & Save Analysts Time

Many organizations today are unlocking the power of their data by using graph databases to feed downstream analytics, enahance visualizations, and more. Yet, when different graph nodes represent the same entity, graphs get messy. Watch this essential video with Senzing CEO Jeff Jonas on how adding entity resolution to a graph database condenses network graphs to improve analytics and save your analysts time.

article thumbnail

Trailblazing Sarabjot Singh’s Journey of Education, Innovation, and Social Impact

Analytics Vidhya

In the ever-evolving landscape of data science, individuals like Sarabjot Singh stand as luminaries, pioneering the fusion of academia and entrepreneurship to drive innovation. From his early days in pioneering algorithms to co-founding successful ventures like Tatras Data, his journey epitomizes the transformative potential of data-driven solutions.