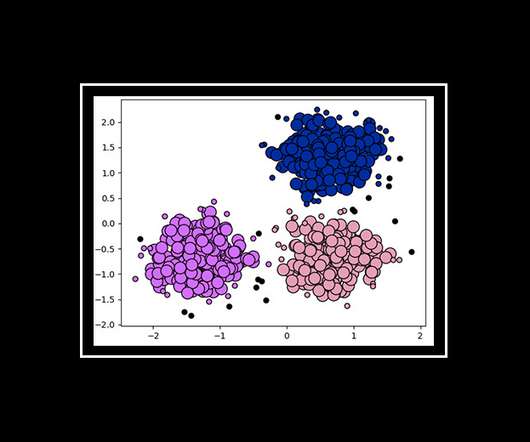
A Simple Explanation of K-Means Clustering
Analytics Vidhya
OCTOBER 4, 2020
This article was published as a part of the Data Science Blogathon. Overview K-means clustering is a very famous and powerful unsupervised machine learning. The post A Simple Explanation of K-Means Clustering appeared first on Analytics Vidhya.


Let's personalize your content