Remove Forecasting Remove Metrics Remove Slice and Dice Remove Snapshot
article thumbnail

Blending Art and Science: Using Data to Forecast and Manage Your Sales Pipeline

Sisense

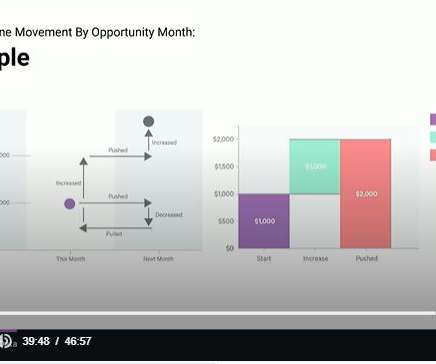
Analytics and sales should partner to forecast new business revenue and manage pipeline, because sales teams that have an analyst dedicated to their data and trends, drive insights that optimize workflows and decision making. Daily snapshot of opportunities that’s derived from a table of opportunities’ histories.

Sales 91
article thumbnail

Move Beyond Excel, PowerPoint And Static Business Reporting with Powerful Interactive Dashboards

datapine

An interactive dashboard is a data management tool that tracks, analyzes, monitors, and visually displays key business metrics while allowing users to interact with data, enabling them to make well-informed, data-driven, and healthy business decisions. Each dashboard created should be a live snapshot of your business.