Remove how-to-organize-your-powerpoint-slides-by-adding-sections
article thumbnail

A Trick, a Tip and a Thing to Try in Your Next Presentation

Depict Data Studio

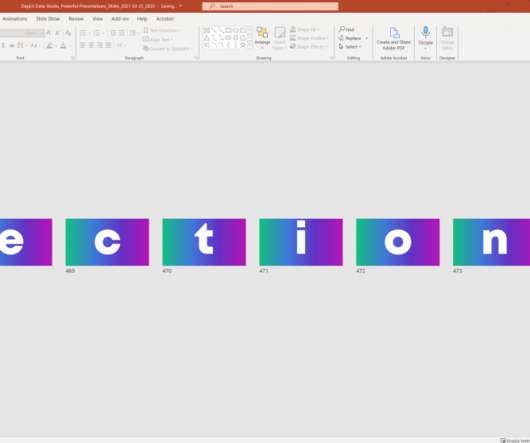
Presentations Trick: Adding Perfect Shapes. Sooner rather than later you’ll need to insert a shape into your slide, and often you’ll want that shape to be a perfect circle or square. Sooner rather than later you’ll need to insert a shape into your slide, and often you’ll want that shape to be a perfect circle or square.

article thumbnail

How to Organize Your PowerPoint Slides by Adding Sections

Depict Data Studio

Want to organize your PowerPoint slides a little better? There’s a behind-the-scenes trick that I love using in my own presentations: Sections! I was scrolling through my slides, and someone asked how I created these “sections” to organize my content. What Are PowerPoint Sections?

IT 94
Insiders

Sign Up for our Newsletter

This site is protected by reCAPTCHA and the Google Privacy Policy and Terms of Service apply.

Trending Sources

article thumbnail

It's Not The Ink, It's The Think: 6 Effective Data Visualization Strategies

Occam's Razor

Ten years, and the 944,357 words, are proof that I love purposeful data, collecting it, pouring smart strategies into analyzing it, and using the insights identified to transform organizations. Here are the sections in this post: An important assumption. Sell smarter, make choices, love your boss/client. simplification and 2.

article thumbnail

How To Create Data Reports That Will Skyrocket Your Business Performance

datapine

The term usually conjures up images of static PDFs, old-school PowerPoint slides and big tables. If you utilize business intelligence correctly, not only you will be able to connect your data dots, but take control of your data across the company and improve your bottom line. It doesn’t have to be this way.

Reporting 127
article thumbnail

My 6 Data Communications Classes

Depict Data Studio

You’ll need to have your graphs created and edited first (skills taught in previous classes) so they can feed into those reports, dashboards, and presentations. Class 1: Simple Spreadsheets: How to Analyze Data from Start to Finish in Excel Need to make sense of spreadsheets? Not sure where to start?

article thumbnail

The Data Visualization Design Process: A Step-by-Step Guide for Beginners

Depict Data Studio

Visualizing data in charts, graphs, dashboards, and infographics is one of the most powerful strategies for getting your numbers out of your spreadsheets and into real-world conversations. Step 1: Understand Your Audience Wait! Don’t start making graphs on your computer! First, you need to analyze your audience.