How to Use Repeating Diagrams to Visualize Qualitative Concepts
Depict Data Studio
NOVEMBER 14, 2022
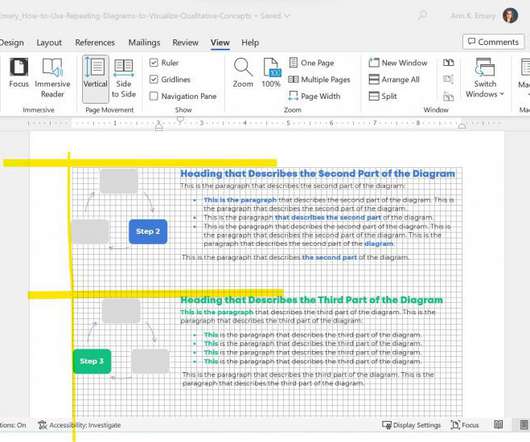
Let’s stop hiding important qualitative concepts inside Text Walls that no one reads. We’ll use landscape so that it’s easier to see on a landscape computer screen. Step 1: Choose Your Diagram. Here are the most common diagrams I’ve used to visualize qualitative concepts in research and evaluation projects: Processes.


Let's personalize your content