Remove Interactive Remove Knowledge Discovery Remove Optimization Remove Technology
article thumbnail

4 ways generative AI addresses manufacturing challenges

IBM Big Data Hub

Facing a constant onslaught of cost pressures, supply chain volatility and disruptive technologies like 3D printing and IoT. The industry must continually optimize process, improve efficiency, and improve overall equipment effectiveness. Summarization Summarization remains the top use case for generative AI (gen AI) technology.


article thumbnail

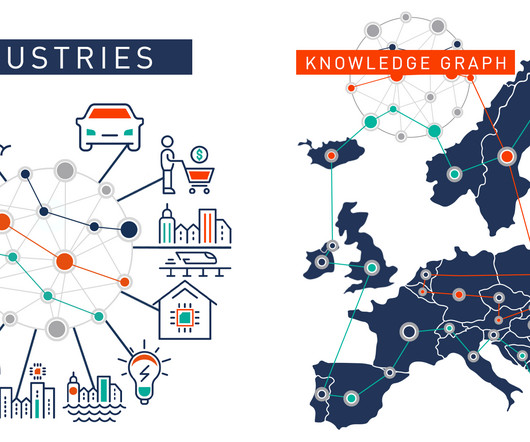
Bridging the Gap Between Industries: The Power of Knowledge Graphs – Part I

Ontotext

Knowledge graphs can also enable the creation of “digital twins”, which make sense of the collected data from various sensors in different systems, spanning the entire vehicle lifecycle. Read our post: Okay, You Got a Knowledge Graph Built with Semantic Technology… And Now What? Manufacturing and Industry 4.0

Insiders

Sign Up for our Newsletter

This site is protected by reCAPTCHA and the Google Privacy Policy and Terms of Service apply.

article thumbnail

Understanding Social And Collaborative Business Intelligence

datapine

This is done using interactive Business Intelligence and Analytics dashboards along with intuitive tools to improve data clarity. Resources can be optimized through this type of sharing by allowing users to access reports, dashboards, and data that can possibly be just what they require to complete a task or analysis. Author Bio: .

article thumbnail

KGF 2023: Bikes To The Moon, Datastrophies, Abstract Art And A Knowledge Graph Forum To Embrace Them All

Ontotext

It enriched their understanding of the full spectrum of knowledge graph business applications and the technology partner ecosystem needed to turn data into a competitive advantage. Content and data management solutions based on knowledge graphs are becoming increasingly important across enterprises.

article thumbnail

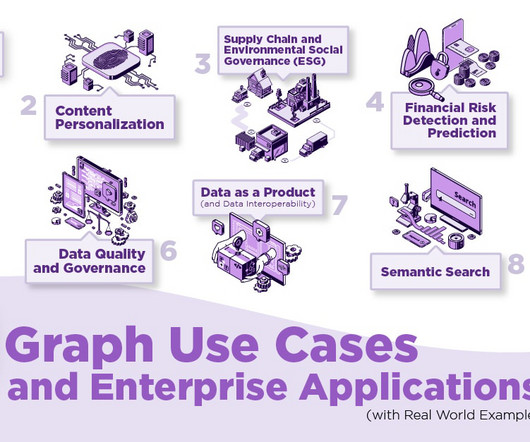
Top Graph Use Cases and Enterprise Applications (with Real World Examples)

Ontotext

Gartner predicts that graph technologies will be used in 80% of data and analytics innovations by 2025, up from 10% in 2021. Several factors are driving the adoption of knowledge graphs. Graph solutions have gained momentum due to their wide-ranging applications across multiple industries. We get this question regularly.

article thumbnail

Experiment design and modeling for long-term studies in ads

The Unofficial Google Data Science Blog

A/B testing is used widely in information technology companies to guide product development and improvements. This is essentially the same as finding a truly useful objective to optimize. Depending on the average ad quality the different cohorts are exposed to, their willingness to interact with our ads changes over time.

article thumbnail

Understanding Social And Collaborative Business Intelligence

datapine

This is done using interactive Business Intelligence and Analytics dashboards along with intuitive tools to improve data clarity. Resources can be optimized through this type of sharing by allowing users to access reports, dashboards, and data that can possibly be just what they require to complete a task or analysis. Author Bio: .