Remove self-guided-demo-overview
article thumbnail

What Is Alation Connected Sheets? Q&A with the Creators

Alation

We wanted to make it easy for anyone to pull data and self service without the technical know-how of the underlying database or data lake. They had reached out to us as they were struggling to give their finance teams self service-access to data from Oracle. We’ve got you covered: Join a self-guided demo.

article thumbnail

What is a KPI Report? Definition, Examples, and How-tos

FineReport

Each section provides an overview of the revenue generated by these channels and the corresponding budget allocated. This information can guide decision-making processes, help identify areas for improvement, and optimize marketing strategies to achieve better results.

KPI 52
Insiders

Sign Up for our Newsletter

This site is protected by reCAPTCHA and the Google Privacy Policy and Terms of Service apply.

article thumbnail

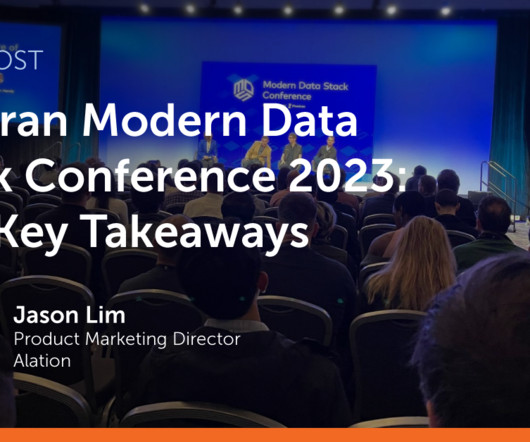
Fivetran Modern Data Stack Conference 2023: Key Takeaways

Alation

In this blog, I’ll share a quick high-level overview of the event, with an eye to core themes. We had a great time meeting with customers and demonstrating how a data intelligence platform delivers visibility across the data stack with demos. Let’s dive in! Mitesh Shah , VP of Product Marketing, took the stage to answer this question.

article thumbnail

6 benefits of data lineage for financial services

IBM Big Data Hub

Download the Gartner® Market Guide for Active Metadata Management 1. Data lineage can help to automate routine tasks and enable self-service wherever possible, allowing data scientists and other stakeholders to retrieve up-to-date lineage and data origin information on their own, whenever they need it. Don’t wait.

article thumbnail

Accomplish Agile Business Intelligence & Analytics For Your Business

datapine

That said, in this article, we will go through both agile analytics and BI starting from basic definitions, and continuing with methodologies, tips, and tricks to help you implement these processes and give you a clear overview of how to use them. Support collaboration and self-management. Automate as much as possible.

article thumbnail

The Ultimate Guide to Creating a Sales Dashboard: Tips and Tricks

FineReport

This guide provides a comprehensive overview of sales dashboards, including their definition, significance, steps for creating one, and useful tips. Modern sales dashboards simplify sales management by providing a daily or strategic-level overview of team performance, sales opportunities, closed deals, and other essential sales KPIs.

article thumbnail

HR Dashboard: Everything You Need To Know

FineReport

Feel free to take full advantage of this guide! KPIs and Metrics of an HR Dashboard A human resources dashboard should incorporate various essential metrics that offer a comprehensive organizational overview. Refer to our guide on calculating employee turnover for more information. What is an HR Dashboard?