Remove 2006 Remove Experimentation Remove Modeling Remove Visualization
article thumbnail

Towards optimal experimentation in online systems

The Unofficial Google Data Science Blog

Experiments, Parameters and Models At Youtube, the relationships between system parameters and metrics often seem simple — straight-line models sometimes fit our data well. That is true generally, not just in these experiments — spreading measurements out is generally better, if the straight-line model is a priori correct.

article thumbnail

New Format for The Bar Chart Reference Page

The Data Visualisation Catalogue

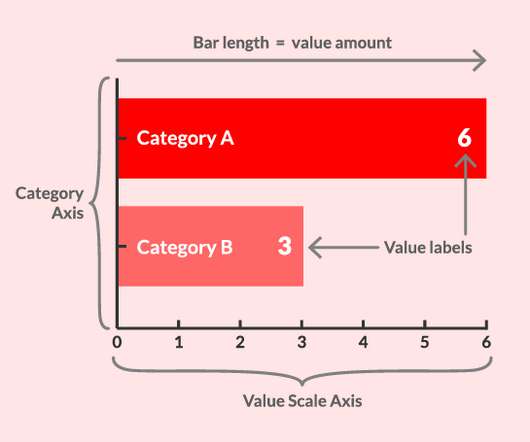
Bar Charts are distinguished from the visually very similar Histogram, as they do not display continuous data over an interval. Visual Arrangements of Bar Charts Influence Comparisons in Viewer Takeaways. Eurographics Conference on Visualization (EuroVis). An Evaluation of the Impact of Visual Embellishments in Bar Charts.

Insiders

Sign Up for our Newsletter

This site is protected by reCAPTCHA and the Google Privacy Policy and Terms of Service apply.

article thumbnail

Web Analytics: Frequently Asked Questions And Direct Answers

Occam's Razor

The best option is to hire a statistician with experience in data modeling and forecasting. Brian Krick: Best way to measure and communicate "available demand" from available channels (social, search, display) for forecast modeling. please refer to the controlled experimentation section, page 205, in the book for more.

article thumbnail

Real-Real-World Programming with ChatGPT

O'Reilly on Data

I’m a professor who is interested in how we can use LLMs (Large Language Models) to teach programming. Here’s how I worked on it: I subscribed to ChatGPT Plus and used the GPT-4 model in ChatGPT (first the May 12, 2023 version, then the May 24 version) to help me with design and implementation.