Remove 2013 Remove Dashboards Remove Measurement Remove Scorecard
article thumbnail

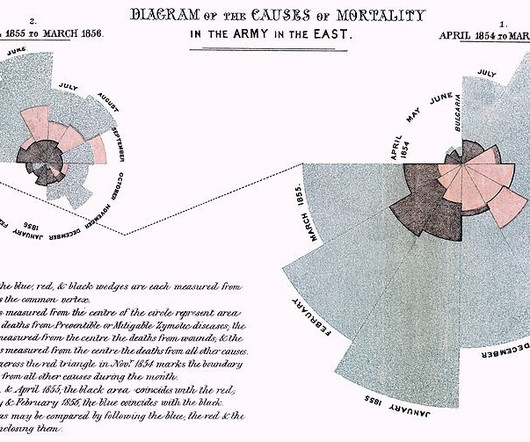
A Brief History of Data Visualization

Jet Global

Editors note: This blog was originally published in October 2013, and has been completely revamped and updated for accuracy, relevancy, and comprehensiveness in September 2019 Prior to the 17th century, data visualization existed mainly in the realm of maps, displaying land markers, cities, roads, and resources.

article thumbnail

Be Real-World Smart: A Beginner's Advanced Google Analytics Guide

Occam's Razor

It is a collection of advanced segments, custom reports, and dashboards. Yet, many don't have access to a well set-up account to build attribution modeling savvy and take their company's analytics the year 2013. Start with the scorecard in the overview report. You'll have lots of features incorporated in them.

Analytics 109