Remove 2015 Remove Publishing Remove Statistics Remove Visualization
article thumbnail

Take Advantage Of The Best Interactive & Effective Data Visualization Examples

datapine

Table of Contents 1) The Benefits Of Data Visualization 2) Our Top 27 Best Data Visualizations 3) Interactive Data Visualization: What’s In It For Me? 4) Static vs. Animated Data Visualization Data is the new oil? ” – David McCandless Humans are visual creatures. This very notion is the core of visualization.

article thumbnail

Remove Your Rose Tinted Glasses: Data Visualizations Designed to Mislead

datapine

1) Misleading Data Visualization Examples. 2) How to Avoid Misleading Visuals. 3) The Impact Of Bad Data Visualizations. But while that may be the case, people are duped by data visualizations every day. Bad data visualizations come in many forms, with some more obvious than others. Table of Contents.

Insiders

Sign Up for our Newsletter

This site is protected by reCAPTCHA and the Google Privacy Policy and Terms of Service apply.

Trending Sources

article thumbnail

Create High-Impact Data Visualizations: Nine Effective Strategies

Occam's Razor

In service of that belief, there are few things that bring me as much joy as visualizing data (smart segmentation comes close). While I am partial to the simplest of visualizations in a business data context, I love a simple Bar Chart just as much as a Chord or Fisher-Yates Shuffle. 6: Turbocharging Data Visuals with Storytelling.

article thumbnail

Take Your SQL Skills To The Next Level With These Popular SQL Books

datapine

We have already given you our top data visualization books , top business intelligence books , and best data analytics books. Recently published in 2021, “SQL for Data Scientists” by author and experienced data scientist, Rénee Teate, teaches its readers all the skills that data scientists use the most in their daily work.

article thumbnail

MLOps and the evolution of data science

IBM Big Data Hub

Machine learning engineers take massive datasets and use statistical methods to create algorithms that are trained to find patterns and uncover key insights in data mining projects. Build models either visually or with code, and deploy and monitor into production. MLOps and IBM Watsonx.ai

article thumbnail

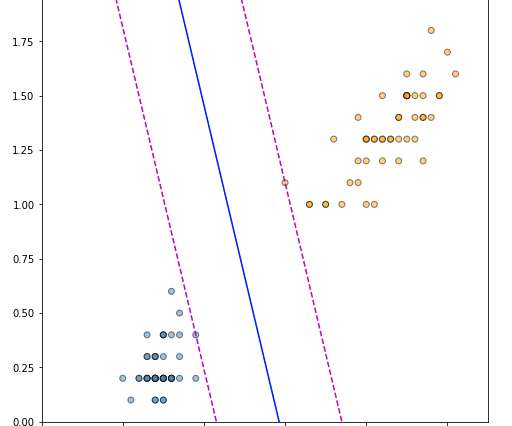
Fitting Support Vector Machines via Quadratic Programming

Domino Data Lab

Support Vector Machines (SVMs) are supervised learning models with a wide range of applications in text classification (Joachims, 1998), image recognition (Decoste and Schölkopf, 2002), image segmentation (Barghout, 2015), anomaly detection (Schölkopf et al., Springer International Publishing. 1999) and more. References. Barghout, L.

article thumbnail

PASS Financials: past, present and the Future:

Jen Stirrup

My analysis is based on the Financial statements put forward by PASS using some basic metrics; until you do that piece, you can’t move forward to compare and contrast it with other data since you have not done your ‘descriptive statistical analysis’ first to ensure that the comparison is valid. I have tabulated the information below.

Metrics 104