Remove 2017 Remove Big Data Remove Statistics Remove Visualization
article thumbnail

Big Data Analytics in eLearning: Aspects Everyone Should Know

Smart Data Collective

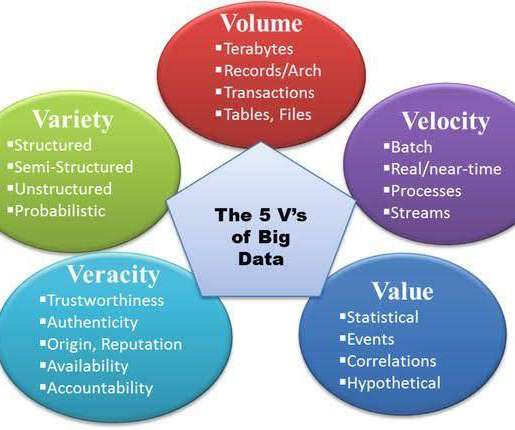
Experts assert that one of the leverages big businesses enjoy is using data to re-enforce the monopoly they have in the market. Big data is large chunks of information that cannot be dealt with by traditional data processing software. Big data analytics is finding applications in eLearning.

Big Data 120
article thumbnail

Top 10 IT & Technology Buzzwords You Won’t Be Able To Avoid In 2020

datapine

Exciting and futuristic, the concept of computer vision is based on computing devices or programs gaining the ability to extract detailed information from visual images. Visual analytics: Around three million images are uploaded to social media every single day. billion in 2017 to $190.61 Artificial Intelligence (AI).

Insiders

Sign Up for our Newsletter

This site is protected by reCAPTCHA and the Google Privacy Policy and Terms of Service apply.

article thumbnail

Themes and Conferences per Pacoid, Episode 9

Domino Data Lab

Finale Doshi-Velez, Been Kim (2017-02-28) ; see also the Domino blog article about TCAV. Adrian Weller (2017-07-29). “ On the other hand, as Lipton emphasized, while the tooling produces interesting visualizations, visualizations do not imply interpretation. ML model interpretability and data visualization.

article thumbnail

Themes and Conferences per Pacoid, Episode 12

Domino Data Lab

He’s been out of Wolfram for a while and writing exquisite science books including Elements: A Visual Explanation of Every Known Atom in the Universe and Molecules: The Architecture of Everything. Historically, grad students in physics and physical sciences have been excellent candidates for data science teams.

article thumbnail

Top 10 Analytics And Business Intelligence Trends For 2020

datapine

Data exploded and became big. Spreadsheets finally took a backseat to actionable and insightful data visualizations and interactive business dashboards. The rise of self-service analytics democratized the data product chain. 2) Data Discovery/Visualization. We all gained access to the cloud.

article thumbnail

Create High-Impact Data Visualizations: Nine Effective Strategies

Occam's Razor

I believe deeply in the value of making data accessible. In service of that belief, there are few things that bring me as much joy as visualizing data (smart segmentation comes close). I’ve curated sixteen extremely diverse visualization examples to do that. 6: Turbocharging Data Visuals with Storytelling.