Remove 2017 Remove Blog Remove Metrics Remove Visualization
article thumbnail

Create Modern SQL Dashboards With Professional Tools & Software

datapine

In some cases, you will need a coding solution where you can build your own queries, but in others, you will also look for a visual representation of your realational data. How To Create SQL Dashboards – Coding & Visuals. The good news is that you can utilize both with the help of a modern and professional SQL dashboard.

article thumbnail

Perform time series forecasting using Amazon Redshift ML and Amazon Forecast

AWS Big Data

to create forecast tables and visualize the data. Time series data is plottable on a line graph and such time series graphs are valuable tools for visualizing the data. The OBJECTIVE parameter specifies a metric to minimize or maximize the objective of a job. In our case, we use Amazon Redshift Query Editor v2.0

Insiders

Sign Up for our Newsletter

This site is protected by reCAPTCHA and the Google Privacy Policy and Terms of Service apply.

Trending Sources

article thumbnail

PASS Financials: past, present and the Future:

Jen Stirrup

My analysis is based on the Financial statements put forward by PASS using some basic metrics; until you do that piece, you can’t move forward to compare and contrast it with other data since you have not done your ‘descriptive statistical analysis’ first to ensure that the comparison is valid. What does that say about the #SQLFamily?

Metrics 104
article thumbnail

13 Essential Data Visualization Techniques, Concepts & Methods To Improve Your Business – Fast

datapine

“By visualizing information, we turn it into a landscape that you can explore with your eyes. 90% of the information transmitted to the brain is visual. Data visualization methods refer to the creation of graphical representations of information. That’s where data visualization comes in. A sort of information map.

article thumbnail

Can we identify 3-D images using very little training data?

Insight

In this blog, I’ll illustrate an approach by walking you through my project during my Data Science Fellowship at Insight , followed by a quick discussion pertaining to broader application. Three views for Object 12: CAD model as visualized by Microsoft’s Print 3D software (left). The first one serves as a baseline for performance.

article thumbnail

Don’t Start from Scratch! Make One of these Dashboards Instead

Depict Data Studio

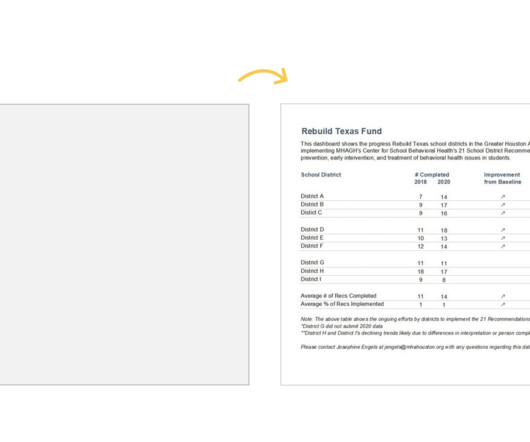
Grant Deliverables In this blog post , you’ll see how Josephine Engels did need to start from scratch — she was visualizing these metrics for her organization for the first time — and then made several dashboards to track grant deliverables. No need to start from scratch. Adapt one of these dashboards instead.

article thumbnail

Towards optimal experimentation in online systems

The Unofficial Google Data Science Blog

the weight given to Likes in our video recommendation algorithm) while $Y$ is a vector of outcome measures such as different metrics of user experience (e.g., This blog post discusses such a comprehensive approach that is used at Youtube. the fraction of video recommendations resulted in positive user experiences).