article thumbnail

How to Calculate Year-Over-Year Growth

Sisense

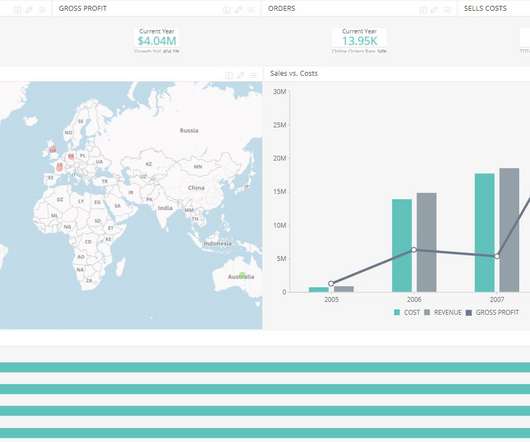
Year-over-year (YOY) growth is a key performance indicator comparing growth in one period (usually a month) against the comparable period twelve months before the previous year, hence the name). Imagine your monthly revenues for January 2018 were $1,000 dollars and revenues for January 2017 were $950.

KPI 96
article thumbnail

Goodbye Oracle Discoverer, Hello Next-Generation Reporting

Jet Global

Note that extended support for Oracle Discoverer ended in 2017. Users who transferred from premier to extended support did not have the benefit of being certified with most new third-party products/versions (such as web browsers and Windows 10), or more new Oracle products.

Insiders

Sign Up for our Newsletter

This site is protected by reCAPTCHA and the Google Privacy Policy and Terms of Service apply.

Trending Sources

article thumbnail

Top 10 Analytics And Business Intelligence Trends For 2020

datapine

According to Gartner, poor data quality is estimated to cost organizations an average of $15 million per year in losses. That’s why it is of utmost importance to start with utilizing the right key performance indicators – there are numerous KPI examples that can make or break the quality process of data management.

article thumbnail

Ultimate Guide to ESG Reporting

Jet Global

At a minimum , companies should provide information relating to their business model, the outcome of their policies, the principal risks they face linked to their business operations, and other non-financial key performance indicators relevant to their business.