Remove 2017 Remove Data mining Remove Data-driven Remove Visualization
article thumbnail

ML internals: Synthetic Minority Oversampling (SMOTE) Technique

Domino Data Lab

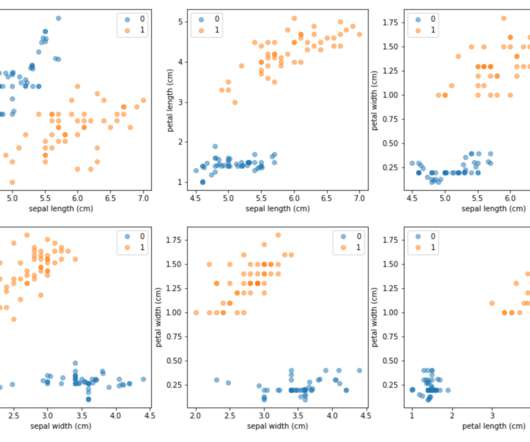
Further, imbalanced data exacerbates problems arising from the curse of dimensionality often found in such biological data. Insufficient training data in the minority class — In domains where data collection is expensive, a dataset containing 10,000 examples is typically considered to be fairly large. 1998) and others).

article thumbnail

Towards optimal experimentation in online systems

The Unofficial Google Data Science Blog

Experiments, Parameters and Models At Youtube, the relationships between system parameters and metrics often seem simple — straight-line models sometimes fit our data well. Figure 4: Visualization of a central composite design. The data showed us that metrics are not exactly straight-line functions of parameters.

Insiders

Sign Up for our Newsletter

This site is protected by reCAPTCHA and the Google Privacy Policy and Terms of Service apply.

Trending Sources

article thumbnail

Top 10 Analytics And Business Intelligence Trends For 2020

datapine

Data exploded and became big. Spreadsheets finally took a backseat to actionable and insightful data visualizations and interactive business dashboards. The rise of self-service analytics democratized the data product chain. 1) Data Quality Management (DQM). We all gained access to the cloud.

article thumbnail

What Is Data Intelligence?

Alation

What Is Data Intelligence? Data intelligence is a system to deliver trustworthy, reliable data. It includes intelligence about data, or metadata. IDC coined the term, stating, “data intelligence helps organizations answer six fundamental questions about data.” These questions are: Who is using what data?