Remove 2017 Remove Metrics Remove Modeling Remove Visualization
article thumbnail

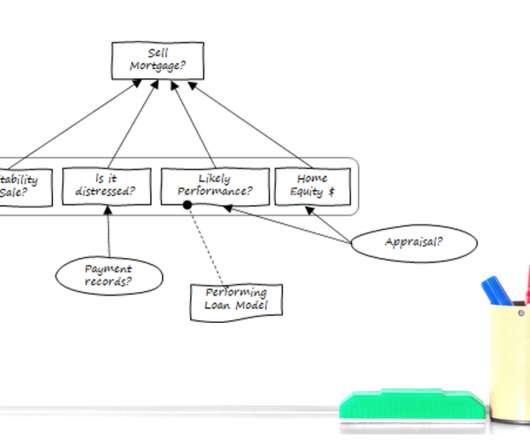
Make Your Investment in Analytic Technology Pay Off With Decision Requirements Modeling

Decision Management Solutions

Like many enterprises, you’ve likely made a hefty investment in analytic technology—from interactive dashboards and advanced visualization tools to data mining, predictive analytics, machine learning (ML), and artificial intelligence (AI). 1 MIT Sloan Management Review September 06, 2017. Focusing on decision-making changes everything.

article thumbnail

Perform time series forecasting using Amazon Redshift ML and Amazon Forecast

AWS Big Data

Amazon Redshift ML makes it easy for data analysts and database developers to create, train, and apply machine learning (ML) models using familiar SQL commands in Amazon Redshift. Simply use SQL statements to create and train SageMaker ML models using your Redshift data and then use these models to make predictions.

Insiders

Sign Up for our Newsletter

This site is protected by reCAPTCHA and the Google Privacy Policy and Terms of Service apply.

Trending Sources

article thumbnail

13 Essential Data Visualization Techniques, Concepts & Methods To Improve Your Business – Fast

datapine

“By visualizing information, we turn it into a landscape that you can explore with your eyes. 90% of the information transmitted to the brain is visual. Data visualization methods refer to the creation of graphical representations of information. That’s where data visualization comes in. A sort of information map.

article thumbnail

Real Talk with A Data Scientist: The Future of Data Wrangling

Data Science 101

I think in physics one of the things that attracted me most to the field that I studied, which was particle physics, was the ability to leverage computer science mathematical modeling and data visualization to solve big questions. And what kind of transformation do you need to apply to the data set to enable modeling?

article thumbnail

What is Advanced Analytics and How Can it Advance Your Organization?

Smarten

Self-Serve Advanced Analytics provides a roadmap to guide you through a maze of organizational data with tools and models that will bring together data from disparate sources and enable sophisticated yet simple analytics. These tools allow the enterprise to establish and monitor key metrics and to objectively assess results.

article thumbnail

Can we identify 3-D images using very little training data?

Insight

My client also specified that CAD model files of the T-LESS dataset be used for this project, and that one object per class be reserved for testing (Objects 4, 8, 12, 18, 23, 30). Three views for Object 12: CAD model as visualized by Microsoft’s Print 3D software (left). The first one serves as a baseline for performance.

article thumbnail

Towards optimal experimentation in online systems

The Unofficial Google Data Science Blog

the weight given to Likes in our video recommendation algorithm) while $Y$ is a vector of outcome measures such as different metrics of user experience (e.g., Experiments, Parameters and Models At Youtube, the relationships between system parameters and metrics often seem simple — straight-line models sometimes fit our data well.