Remove 2019 Remove Dashboards Remove Data mining Remove Statistics
article thumbnail

What is business analytics? Using data to improve business outcomes

CIO Business Intelligence

Business analytics is the practical application of statistical analysis and technologies on business data to identify and anticipate trends and predict business outcomes. Business analytics is a subset of data analytics. What is business analytics? The discipline is a key facet of the business analyst role.

article thumbnail

10 Skill Yang Perlu Dikuasai Seorang Data Analyst

FineReport

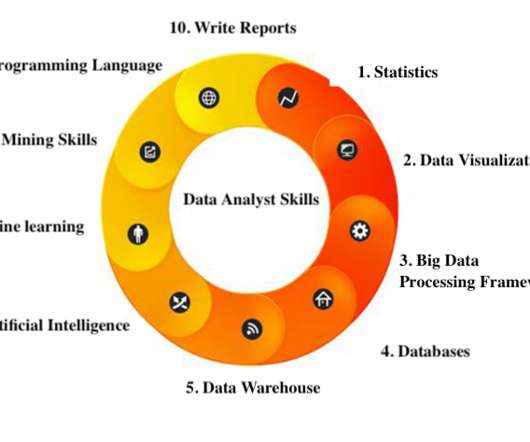
Framework Big Data Processing: Hadoop, storm, spark. Data Warehous: SSIS, SSAS. Skill Data Mining: Matlab, R, Python. Seperti yang Anda ketahui, statistik adalah dasar analisis data. Statistik juga adalah sebuah skill utama seorang data analyst. Anda perlu memahami prinsip dibalik data.

Insiders

Sign Up for our Newsletter

This site is protected by reCAPTCHA and the Google Privacy Policy and Terms of Service apply.

Trending Sources

article thumbnail

Top 10 Analytics And Business Intelligence Trends For 2020

datapine

Spreadsheets finally took a backseat to actionable and insightful data visualizations and interactive business dashboards. The rise of self-service analytics democratized the data product chain. 2019 was a particularly major year for the business intelligence industry.

article thumbnail

How Do Super Rookies Start Learning Data Analysis?

FineReport

Professional data analysts must have a wealth of business knowledge in order to know from the data what has happened and what is about to happen. In addition, tools for data analysis and data mining are also important. Excel, Python, Power BI, Tableau, FineReport are frequently used by data analysts.

article thumbnail

Choosing the Reporting Tools: 5 Things You Need To Know

FineReport

Reporting tools are the software help you extract data from the databases, and dynamically display the data in the form of tables, charts, and dashboard. In other words, you can view reporting software as various styles+ dynamic data. . The KPIs can be tracked via dashboards on the TV screen in the meeting. .

article thumbnail

Enterprise Reporting: The 2020’s Comprehensive Guide

FineReport

The underlying data is responsible for data management, including data collection, ETL, building a data warehouse, etc. Data analysis is mainly about extracting data from the data warehouse and analyzing it with the analysis methods such as query, OLAP, data mining, and data visualization to form the data conclusion.

article thumbnail

What Is Embedded Analytics?

Jet Global

Users Want to Help Themselves Data mining is no longer confined to the research department. Today, every professional has the power to be a “data expert.” Their dashboards were visually stunning. In turn, end users were thrilled with the bells and whistles of charts, graphs, and dashboards.