Remove 2020 Remove Business Intelligence Remove Key Performance Indicator Remove KPI
article thumbnail

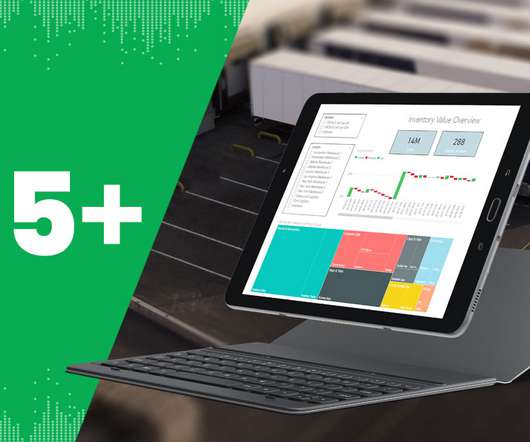
28 Best Insurance KPIs and Metrics Examples for 2020 Reporting

Jet Global

What Is an Insurance KPI? An insurance Key Performance Indicator (KPI) or metric is a measure that an insurance company uses to monitor its performance and efficiency. These KPIs are often used to compare companies in the insurance industry against each other to see which would be a better investment.

article thumbnail

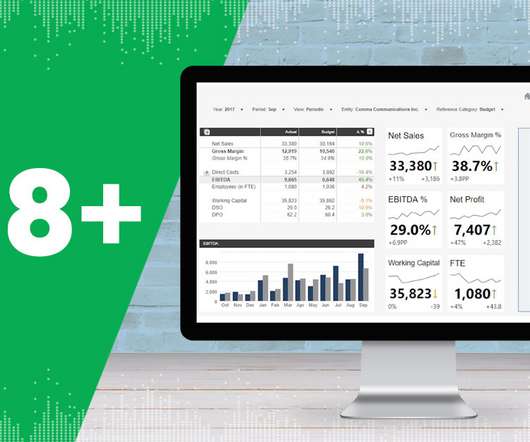
SaaS Dashboard Examples For Modern Business Management Practices

datapine

In the Age of Information, digital technologies have evolved to such an extent that a wealth of tools, applications, and platforms exists to enhance the way businesses operate in a number of areas. A SaaS dashboard is a powerful business intelligence tool that offers a host of benefits for ambitious tech businesses.

Insiders

Sign Up for our Newsletter

This site is protected by reCAPTCHA and the Google Privacy Policy and Terms of Service apply.

Trending Sources

article thumbnail

Top 35+ Distribution KPIs and Metric Examples for 2020 Reporting

Jet Global

What Is a Distribution KPI? A distribution Key Performance Indicator (KPI) or metric is a measure that a company in the distribution sector uses to monitor its performance and efficiency. As such, this post will go over distribution KPI examples that cover operational, lean, and financial performance.

Metrics 52
article thumbnail

An Introduction To Data Dashboards: Meaning, Definition & Industry Examples

datapine

According to the EMC Digital Universe study, by 2020, around 40 trillion megabytes – or 40 zettabytes – will exist in our digital landscape. Enter data dashboards – one of history’s best innovations in business intelligence. When it comes to business intelligence, data dashboards play a pivotal role.

article thumbnail

30 Best Manufacturing KPIs and Metric Examples for 2020 Reporting

Jet Global

What Is A Manufacturing KPI? A manufacturing Key Performance Indicator (KPI) or metric is a well defined and quantifiable measure that the manufacturing industry uses to gauge its performance over time. Why Your Company Should Be Using Manufacturing Specific KPIs to Stay Competitive. View Guide Now.

article thumbnail

Your Modern Business Guide To Data Analysis Methods And Techniques

datapine

Once you’ve set your data sources, started to gather the raw data you consider to offer potential value, and established clearcut questions you want your insights to answer, you need to set a host of key performance indicators (KPIs) that will help you track, measure, and shape your progress in a number of key areas.

article thumbnail

13 Essential Data Visualization Techniques, Concepts & Methods To Improve Your Business – Fast

datapine

Recent studies discovered that the use of visualizations in data analytics could shorten business meetings by 24%. Moreover, a business intelligence strategy with visualization capabilities boasts a ROI of $13.01 back on every dollar spent. Gauge charts can be effectively used with a single value or data point.