Remove Advertising Remove KPI Remove Marketing Remove Statistics
article thumbnail

Dashboard Metrics: Your KPI Guidelines and Practices

FineReport

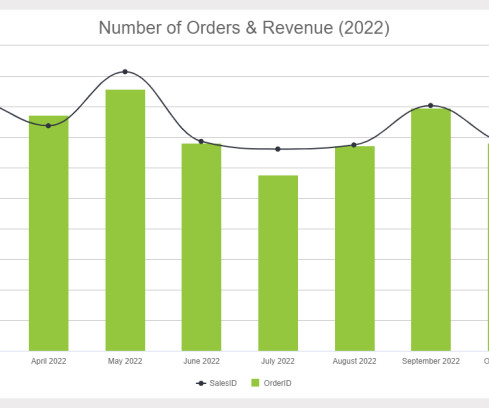
These KPI metrics are critical data to analyze and evaluate a company’s sales, human resources, and marketing, and operational activities. Dashboard metrics tool tracks key performance indicators to monitor marketing activities over time and across various channels. KPI Dashboard (From FineReport?. Cost per hire.

KPI 52
article thumbnail

A Complete Guide To Bar Charts With Examples, Benefits, And Different Types 

datapine

This is a common practice in the media, advertising, and politics, where values are manipulated to make the audiences believe certain conclusions. In that regard, using a professional KPI dashboard is a great way to provide context and tell a complete data story. Therefore, the grouped chart is a great tool to display this data.

Insiders

Sign Up for our Newsletter

This site is protected by reCAPTCHA and the Google Privacy Policy and Terms of Service apply.

article thumbnail

What Is The Difference Between Business Intelligence And Analytics?

datapine

While some experts try to underline that BA focuses, also, on predictive modeling and advanced statistics to evaluate what will happen in the future, BI is more focused on the present moment of data, making the decision based on current insights. Most BI software in the market are self-service.

article thumbnail

A Complete Guide To Finding The Product Metrics That Matter

datapine

As a PM, collecting information about your product performance, its features, the market adoption, etc., Each of these examples, generated with a professional KPI tool , will enable you to monitor your product performance, according to what you decide to prioritize on your strategic roadmap. is essential. Let’s dive in!

Metrics 141
article thumbnail

A Complete Guide To The Power Of Line Graphs With Examples On When To Use Them

datapine

Every day, we encounter graphical representations of data in our jobs and also in the news or advertisements. For example, you can use a line diagram to show historical sales volume and identify seasonal effects to plan your production and marketing strategies ahead of time. Now, let’s discuss some of the limitations.

article thumbnail

Remove Your Rose Tinted Glasses: Data Visualizations Designed to Mislead

datapine

From political issues to sports statistics and the recent report you received on the ROI of your company blog, the internet as well as informational reports are flooded with examples of misleading data visualization. If you want to go deeper into the topic, take a look at our misleading statistics blog post. Correlating Causation.

article thumbnail

Take Advantage Of Professional Social Media Reports – Examples & Templates

datapine

Here, we explore the meaning and value of social reporting plus the value of a social media marketing report , as well as the tools you need to get the job done properly – starting by considering what these reports are and their role in today’s hyper-connected business world. Exclusive Bonus Content: Take Full Advantage of Social Platforms!

Reporting 178