Remove Analytics Remove Contextual Data Remove Dashboards Remove Visualization
article thumbnail

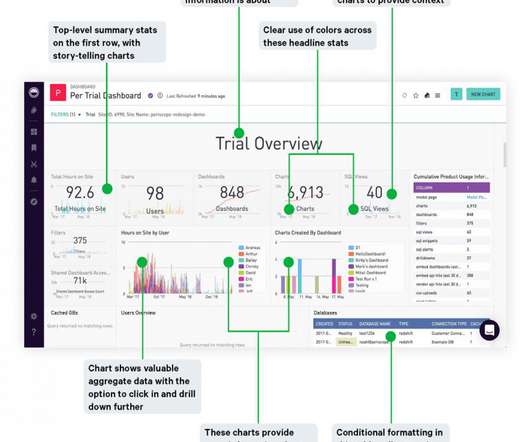
How to Design Better Dashboards: a Visual Guide

Sisense

Everyone wants to get more out of their data, but how exactly to do that can leave you scratching your head. Our BI Best Practices demystify the analytics world and empower you with actionable how-to guidance. Better dashboards, better decisions. The two dashboards below were created from the same set of data.

article thumbnail

Data science vs data analytics: Unpacking the differences

IBM Big Data Hub

Though you may encounter the terms “data science” and “data analytics” being used interchangeably in conversations or online, they refer to two distinctly different concepts. Meanwhile, data analytics is the act of examining datasets to extract value and find answers to specific questions.

Insiders

Sign Up for our Newsletter

This site is protected by reCAPTCHA and the Google Privacy Policy and Terms of Service apply.

Trending Sources

article thumbnail

Digital Dashboards: Strategic & Tactical: Best Practices, Tips, Examples

Occam's Razor

I'm excited about the power of a well created dashboard. Dashboards are every where, we will look at a lot of them in this post and they are all digital. Here's a great dashboard, for the Museum of Art… take a minute to ponder it… Isn't it pretty awesome? They are data pukes. Still a data puke.

article thumbnail

The Future of AI in the Enterprise

Jet Global

The optimized data warehouse isn’t simply a number of relational databases cobbled together, however—it’s built on modern data storage structures such as the Online Analytical Processing (or OLAP) cubes. Cubes are multi-dimensional datasets that are optimized for analytical processing applications such as AI or BI solutions.

article thumbnail

BRIDGEi2i Newsletter: May 2020 Recap

bridgei2i

BRIDGEi2i was honored with its second Honorable Mention in Gartner’s 2020 Magic Quadrant for Data and Analytics Service Providers, Worldwide. This report guides data and analytics leaders in the evaluation phase of service providers. by Analytics India Magazine (AIM). COVID Visualization Dashboards.

article thumbnail

Five benefits of a data catalog

IBM Big Data Hub

In other words, a data catalog makes the use of data for insights generation far more efficient across the organization, while helping mitigate risks of regulatory violations. Because Alex can use a data catalog to search all data assets across the company, she has access to the most relevant and up-to-date information.

article thumbnail

The Future of AI in the Enterprise

Jet Global

The optimized data warehouse isn’t simply a number of relational databases cobbled together, however—it’s built on modern data storage structures such as the Online Analytical Processing (or OLAP) cubes. Cubes are multi-dimensional datasets that are optimized for analytical processing applications such as AI or BI solutions.