Remove Analytics Remove Data Collection Remove Metrics Remove Slice and Dice
article thumbnail

Web Analytics 101: Definitions: Goals, Metrics, KPIs, Dimensions, Targets

Occam's Razor

. "What is the difference between a metric and a key performance indicator (KPI)?" " "What is a dimension in analytics?" " "Are goals metrics?" There seems to be genuine confusion about the simplest, most foundational, parts of web metrics / analytics. " And many more.

Metrics 138
article thumbnail

The Complete Digital Analytics Ecosystem: How To Win Big

Occam's Razor

The world of digital analytics seems to be insanely complicated. I led a discussion the other day with a collection of people who were brand new to the space and some who were jaded long-term residents of Camp Web Analytics. Digital Analytics Ecosystem: The Inputs. Digital Analytics Ecosystem: The Outputs.

Analytics 150
Insiders

Sign Up for our Newsletter

This site is protected by reCAPTCHA and the Google Privacy Policy and Terms of Service apply.

Trending Sources

article thumbnail

What Is Embedded Analytics?

Jet Global

Introduction Why should I read the definitive guide to embedded analytics? But many companies fail to achieve this goal because they struggle to provide the reporting and analytics users have come to expect. The Definitive Guide to Embedded Analytics is designed to answer any and all questions you have about the topic.

article thumbnail

Ten Hidden Gems In Google Analytics: Do Smarter Web Data Analysis!

Occam's Razor

The 80/20 rule applies to our use of web analytics tools as well. I recommend that periodically you gather folks around you for lunch, pull up Adobe Analytics on the big screen in the conference room, let each person expose one hidden report or feature. Google Analytics Shortcuts: Save Your Complex Views. This hurts my feelings!

Analytics 155
article thumbnail

Measuring Validity and Reliability of Human Ratings

The Unofficial Google Data Science Blog

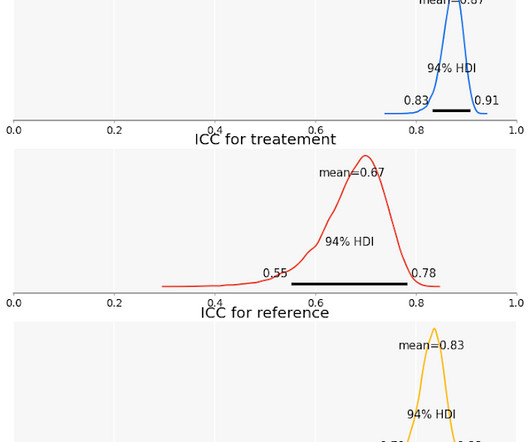
This post describes a generic framework for understanding the quality of human-labeled data, based around the concepts of reliability and validity. It then goes on to show how a new framework called cross-replication reliability (xRR) implements these concepts and how several different analytical techniques implement this framework.

article thumbnail

Move Beyond Excel, PowerPoint And Static Business Reporting with Powerful Interactive Dashboards

datapine

An interactive dashboard is a data management tool that tracks, analyzes, monitors, and visually displays key business metrics while allowing users to interact with data, enabling them to make well-informed, data-driven, and healthy business decisions. It’s most likely that your data isn’t living in one spot.

article thumbnail

Empowering Analysis Ninjas? 12 Signs To Identify A Data Driven Culture

Occam's Razor

Every indicator we have is that companies are investing more in every facet of analytics. There is an analytics ladder of awesomeness each company needs to climb, and it just takes time. First… it is important to realize that big data's big imperative is driving big action. You know what your Return on Analytics is!